
The 50 Most Common User Research Methods, Ranked by Value

Summary: The 50 most common user research methods scored on breadth of scope, depth of insights, remote suitability, and cost, then ranked by total value. Cheap, remote-friendly methods rule. Moderated usability testing and user interviews top the list, while prestige methods sink: eyetracking scores 0, and biometric testing has the only negative value on the list, −2.

A user research method must generate or collect user data: directly, by observing or questioning users, or indirectly, by analyzing traces users leave behind, such as reviews, support tickets, search queries, and analytics events. That rule excludes two popular families. Usability inspection methods (heuristic evaluation, expert reviews, cognitive walkthroughs, and standards checklists) produce expert judgment rather than user data; use them as cheap supplements to empirical research, never as substitutes. (I introduced heuristic evaluation with Rolf Molich in 1990 and still recommend it, but it belongs in the inspection toolbox, not on this list.) Prioritization and synthesis techniques (the Kano model, personas, journey maps, task models) organize research findings; they collect none. Both families are valuable. Neither is user research.
One more boundary decision: remote and in-person delivery are logistics, not methodology. Moderated usability testing is a single method whether the participant sits in your lab or on the other side of a video call. Moderated and unmoderated testing, however, differ in kind (a moderator probes; a platform can’t), so they stay separate.

Most user researchers stick to a small number of well-worn methods. I hope this article inspires you to try a few new methods: set a goal to use a new research method at least once per quarter. You’ll probably still end up with a small toolbox of frequently-used methods that work for most problems. But it’s good to have the bigger toolkit in your workshop.
The Value Formula Rewards Insight per Dollar
Product teams ask two questions about any research method: what can it tell us, and what will it cost us? To answer both at once, I scored each of the 50 most common user research methods (AKA UXR, short for user experience research) on 4 criteria:
Breadth of scope (1–10): How many different research questions can the method answer? Broadly applicable methods score high; methods that target a single narrow problem score low.
Depth of insights (1–10): How fundamental are the likely discoveries? Methods that can produce product-changing revelations score high; methods that mainly generate minor design tweaks score low.
Remote suitability (1–5): How well does the method work when researcher and participant never share a room?
Cost (1–10): The total budget required, including the loaded cost of research staff with the skills to run the method properly. Expensive methods score high; shoestring methods score low.
Value = breadth + depth + remote suitability − cost. The theoretical range runs from −7 to +24; my 50 methods span −2 to +18. The individual scores are my estimates, calibrated by 4 decades of using these methods and watching teams misuse them. Quibble with any single number if you like, but the overall pattern is robust: methods that answer many questions deeply from anywhere, at low cost, beat methods that buy precision on a narrow question at a high price. The bottom of the table collects the prestige methods: research that photographs beautifully in a slide deck yet returns little insight per dollar. (I break ties by depth, then breadth, then alphabetical order, because depth is what you’re really paying for.)
Beyond the 4 scored criteria, each method carries two unscored tags. Qualitative or quantitative: does the method produce rich observations from few users, or measurements from many? Behavioral or attitudinal: does it mostly record what users do, or what they think and feel? A few methods straddle a line, and I tag those as both, but most belong overwhelmingly to one camp. The tags don’t enter the value formula; they tell you what kind of evidence you’re buying.
Value Ranking of the 50 Most Common User Research Methods


The 50 Methods, from Best Buy to Budget Buster
Each entry gives the method’s most common name, what it is and where it earns its keep, followed by its 4 criterion scores, total value, and two tags.

1. Moderated Usability Testing. (Read my in-depth article about the 12 steps for user testing.) A researcher watches a participant perform realistic tasks while he or she thinks aloud, probing confusions the moment they surface, which is where the big discoveries hide. Run it over video conferencing or in the same room: the location is logistics, not method. Remote sessions cost less and can recruit globally; the usability lab still wins for hardware products, safety-critical domains, and participants who struggle with video calls. 5 users per round find most problems. The workhorse of UX research. Good sessions live or die on task design: give participants a realistic goal (“you need to reimburse a $340 expense”), never a click-by-click script, and never words that appear in the interface. When the participant asks for help, bounce the question back (“What would you do if I weren’t here?”) and stay quiet; silence is the moderator’s scalpel. Plan 3–5 tasks per 60-minute session, and run several small rounds of 5 users each rather than one grand study of 20, fixing problems between rounds. The deliverable is a prioritized problem list with severity ratings, actionable enough to start the fixes the next day. Scores: breadth 9, depth 8, remote 5, cost 4. Value: 18. Qualitative; behavioral.

2. User Interviews. Semi-structured 1:1 conversations about needs, workflows, and pain points. Interviews are the fastest route into users’ vocabulary, goals, and mental models, and you can point them at almost any research question. But memory is unreliable, and people misreport their own behavior, so treat every claim as a hypothesis to verify with behavioral data. Cheap, remote-friendly, and endlessly reusable. Craft separates good interviews from friendly chat. Anchor every question in a specific past episode (“Walk me through the last time you booked a business trip”) instead of asking for generalities, because generalities produce the person’s self-image rather than his or her reality. Never pitch your product mid-interview, and never ask “Would you use a feature that...?”; hypothetical demand is worthless. Follow surprises with “why” until you hit bedrock, usually 2–3 layers down. Around 5–8 interviews per user segment reach saturation, and AI transcription has cut analysis time enough that there’s no excuse for skipping the recordings. Scores: breadth 9, depth 6, remote 5, cost 4. Value: 16. Qualitative; attitudinal.

3. Product Analytics. Instrumented behavioral data from the live product: funnels, retention curves, feature adoption, and drop-off points. Analytics show what thousands of users actually do, which no interview can. They never explain why. Pair the numbers with qualitative follow-up, or you’ll optimize the wrong thing with great statistical confidence. Start with instrumentation, because analytics inherit the quality of their events: define events around user goals (completed a booking) rather than interface mechanics (clicked button 4), or every analysis downstream will answer the wrong question. The core views are funnels (where do users leak out of a flow?), cohorts (does retention improve for people who joined after the redesign?), and segmentation (do new users behave like the veterans?). Beware vanity metrics: page views and time on site both rise when users get lost. When a funnel step bleeds users, don’t guess; watch 10 session replays of that exact step. Scores: breadth 7, depth 5, remote 5, cost 4. Value: 13. Quantitative; behavioral.

4. Unmoderated Usability Testing. Participants complete predefined tasks on their own while a platform records screen and voice, and the researcher reviews the recordings later. It’s fast, cheap, and scalable to dozens of participants overnight. The price is depth: nobody probes the interesting moments, so you mostly harvest surface problems. Task wording decides everything. Pilot before you launch: run the task set past 1–2 participants first, because a misread instruction multiplied by 30 panelists produces 30 useless recordings. Write a strict screener; professional panelists have learned to speed-run studies, so include a question with a verifiable answer and reject the box-checkers. Watch recordings at 1.5–2 times speed, timestamp every stumble, and tally which problems repeat. Unmoderated testing shines for evaluative checkups on a design you already understand, for comparing two alternatives, and for reaching users in 12 countries overnight. For discovery work, where the surprises live in the follow-up question, spring for a moderator. Scores: breadth 6, depth 5, remote 5, cost 3. Value: 13. Both qualitative and quantitative; behavioral.

5. Diary Studies. Participants log their experiences over days or weeks in their real context, usually through a mobile app. Diaries expose longitudinal patterns that 1-hour sessions can’t reach: triggers, workarounds, abandonment, and habit formation. Expect dropouts along the way and a mountain of entries to analyze at the end. Match the diary length to the behavior’s natural rhythm: 1–2 weeks covers daily habits, while monthly behaviors (paying bills, filing expenses) need 4–6 weeks or an event-triggered design where participants log only when the behavior occurs. Over-recruit by about 30%, because attrition is guaranteed, and structure incentives as pay-per-entry plus a completion bonus so the economics favor finishing. Send a personal check-in on day 2 or 3; participants who lapse early rarely return. And always end with a debrief interview that walks through the person’s own entries, because the best material is usually one cryptic note that needs unpacking. Scores: breadth 6, depth 8, remote 5, cost 7. Value: 12. Qualitative; both behavioral and attitudinal.
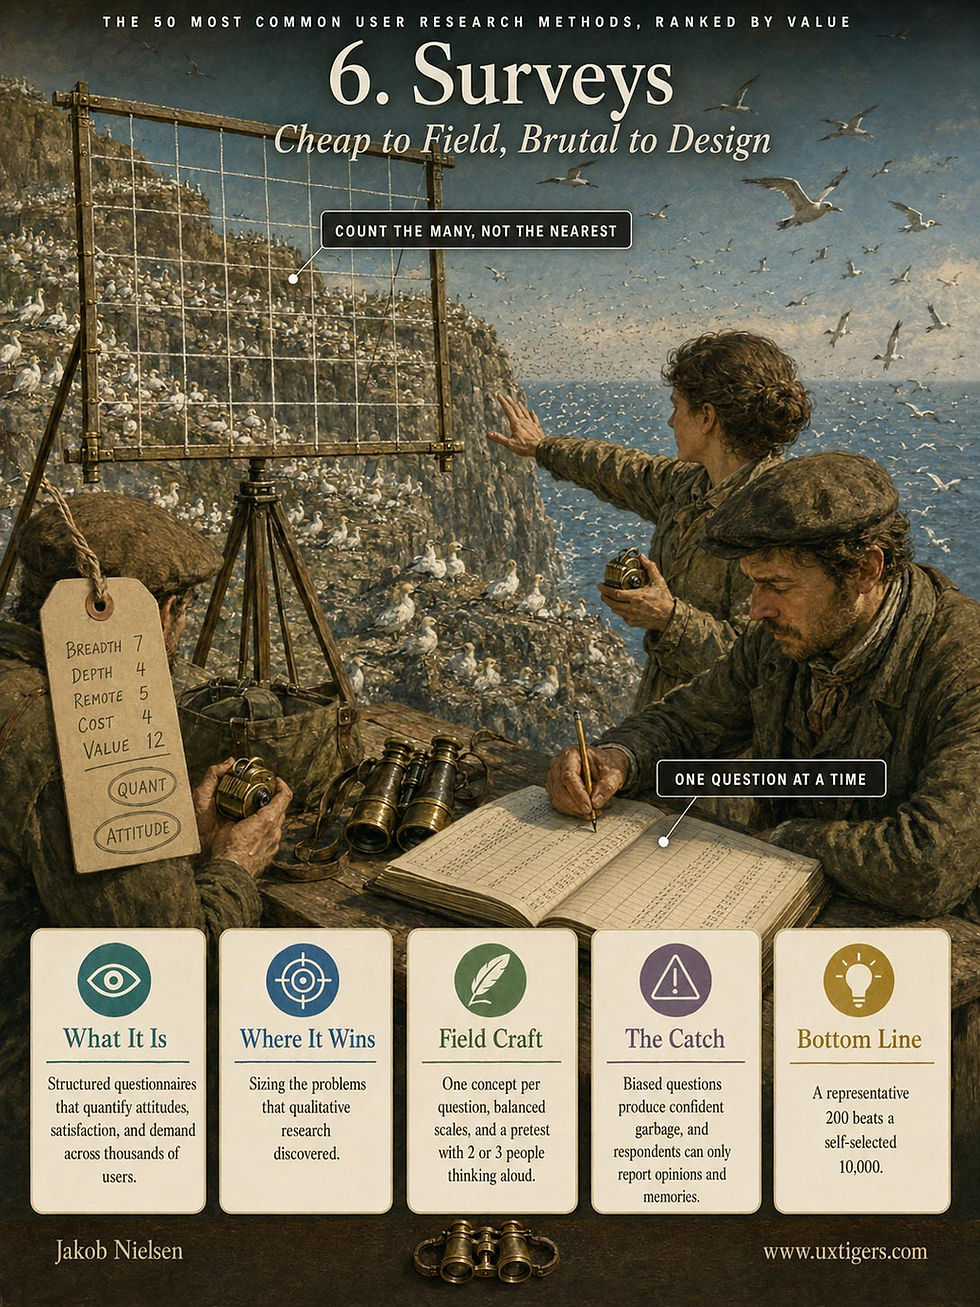
6. Surveys. Structured questionnaires quantify attitudes, satisfaction, and feature demand across hundreds or thousands of users. Surveys are cheap to field and brutal to design well: biased questions produce confident garbage. And respondents can only report opinions and memories, both of which mislead. Use surveys to size the problems that qualitative research discovered. The craft is in the questions. Ask about one concept at a time (a double-barreled question like “Was the site fast and easy to use?” is unanswerable), balance the response scales, and randomize option order where it matters. Pretest by watching 2–3 people think aloud while answering; you’ll discover that respondents read your questions in ways you never intended. Keep completion under 5 minutes, because every extra minute skews the sample toward people with time to burn. And a well-drawn sample of 200 beats a self-selected sample of 10,000: representativeness trumps volume. Never survey users about behavior your analytics already record. Scores: breadth 7, depth 4, remote 5, cost 4. Value: 12. Quantitative; attitudinal.

7. Stakeholder Interviews. Conversations with the people inside your own building: sales, support, executives, and subject-matter experts. They map business goals, constraints, and years of accumulated customer knowledge in a week. It’s secondhand data about users, so verify before you build. As orientation at the start of a project, nothing is cheaper. Book 30–45 minutes each with 6–10 people across functions: support agents hear complaints all day, salespeople know where deals die, engineers know which constraints are real, and executives reveal what the company believes about its users. That last part matters most. Ask each person, “What do we all assume about our users that nobody has ever tested?”, and write the answers down as a hypothesis list for your empirical research to confirm or demolish. The interviews also build something no other method on this list delivers: political capital. Stakeholders who felt heard at the start defend the research budget at the end. Scores: breadth 5, depth 4, remote 5, cost 2. Value: 12. Qualitative; attitudinal.

8. Contextual Inquiry. The researcher visits a user’s real environment and watches him or her work, asking questions in the flow of the task, apprentice-style. Hugh Beyer and Karen Holtzblatt codified the technique in the 1990s. Context reveals what interviews miss: interruptions, sticky notes, workarounds, and the second monitor full of Excel. Travel makes it pricey, but the workflow insight runs deep. Play the apprentice: the user is the master craftsman, and your job is to learn the trade, so ask “Why did you just do that?” while the action is still on the screen instead of saving questions for the end. Hunt for artifacts: the printed cheat sheet taped to the monitor, the Excel export that routes around your product, the sticky note with the workaround. Each one marks a design failure somebody already solved with paper. Visits of about 2 hours with 4–6 users usually saturate a single workflow. Debrief with the team the same day, while details are vivid. For purely desk-based work, a screen-share version recovers perhaps 2/3 of the value. Scores: breadth 8, depth 9, remote 2, cost 8. Value: 11. Qualitative; behavioral.

9. Jobs-to-be-Done Interviews. A specialized interview protocol that reconstructs the timeline of a recent purchase or switch: what job the customer hired the product to do, what triggered the search, and what almost stopped him or her. JTBD interviews regularly reframe what business you’re actually in, which is why product strategists love them. Recruiting recent switchers takes real effort. The interview walks the timeline backward from the purchase: first thought, passive looking, active comparison, decision, and first use, reconstructing each moment in concrete detail (Where were you? What else was happening that week?). Bob Moesta, who developed the switch-interview technique, maps 4 forces onto every decision: the push of the old frustration, the pull of the new solution, the anxiety about change, and the inertia of habit. Products win by amplifying the first two forces and defusing the last two. Interview customers who switched within the past 90 days, in sessions of 60–90 minutes, and note the competitor they almost chose. Scores: breadth 4, depth 7, remote 5, cost 5. Value: 11. Qualitative; attitudinal.

10. RITE Method. Rapid Iterative Testing and Evaluation: fix problems between sessions instead of writing a report afterward. Test in the morning, change the prototype at lunch, verify the fix in the afternoon. Michael Medlock and colleagues at Microsoft Game Studios introduced RITE in 2002, and it converges on a working design within the week. It demands designers and decision-makers in the room all week. The operating rules matter. Fix a problem immediately only when the cause is obvious and the fix is cheap; when either is in doubt, log it and wait for the next participant to confirm. Schedule 2–3 participants per day across 4–5 days, and hold a 30-minute triage after each session with three possible verdicts: fix now, fix tonight, or gather more evidence. The point is killing the latency between finding a problem and acting on it, which a report read next month can’t do. And guard against overfitting: a fix that helps user 4 must not break users 5 through 8. Scores: breadth 7, depth 6, remote 4, cost 6. Value: 11. Qualitative; behavioral.

11. Session Replay. Recordings of real user sessions in the live product, watched selectively for rage clicks, hesitations, abandoned checkouts, and error loops. Replay is the closest thing to invisible field observation at scale. You see the struggle but never hear the intent, and the privacy handling must be airtight. Never browse recordings at random: filter for sessions with rage clicks, error events, or exits from a specific funnel step, then watch 10–15 of those. Random sampling wastes hours on happy paths. Scores: breadth 5, depth 5, remote 5, cost 4. Value: 11. Qualitative; behavioral.

12. Support Ticket Analysis. Mining tickets, chat logs, and call transcripts for recurring problems. Users who contact support have already prioritized your defect backlog for you, complete with severity signals and their own vocabulary. The data skews toward failures painful enough to report, so the silent sufferers stay invisible. Cluster tickets by theme (AI text analysis has turned this into a 1-day job), score each theme by frequency times severity, and publish a monthly top-10 problem list that product managers can’t ignore. Scores: breadth 5, depth 5, remote 5, cost 4. Value: 11. Qualitative; attitudinal.

13. Review Mining. Systematic analysis of ratings and written reviews on app stores, e-commerce sites, and software review platforms, covering your product and its competitors. It’s voice-of-customer data at scale, already written, and free. The sample skews toward the delighted and the furious, but competitor reviews remain the cheapest product-market fit intelligence you’ll ever collect. Read the 1-star and 5-star reviews as separate datasets: one lists your failures, the other lists what you must never break. A competitor’s 1-star reviews are your treasure map of open opportunities. Scores: breadth 4, depth 5, remote 5, cost 3. Value: 11. Qualitative; attitudinal.

14. Social Media Listening. Monitoring Reddit threads, X posts, and community forums where users discuss your product, your competitors, and the underlying need. People write with refreshing honesty when no researcher is watching. The signal is noisy and skews toward the vocal, but the price is right. Set up standing searches rather than one-off expeditions, and go where your users gather: for B2B products, a niche subreddit or professional forum beats the big platforms. Save the verbatims; users’ own words sharpen your copy. Scores: breadth 5, depth 4, remote 5, cost 3. Value: 11. Qualitative; attitudinal.

15. Ethnographic Field Studies. Extended immersion in the users’ world: days or weeks of observation across multiple sites, sometimes embedded in the work itself. No method digs deeper. Ethnography uncovers needs users can’t articulate and can redefine an entire product strategy. It’s also slow, expensive, and dependent on scarce, highly trained researchers. Reserve it for questions where being wrong costs millions. Visit several sites: a pattern seen once is an anecdote, while a pattern seen at 3 sites is a finding. Budget as many days for analysis as for fieldwork, and expect the output to reframe the problem. Scores: breadth 9, depth 10, remote 1, cost 10. Value: 10. Qualitative; behavioral.

16. Experience Sampling. The researcher pings participants at random or triggered moments (“What are you doing right now? How is it going?”) to capture in-the-moment reports over days or weeks. Sampling beats memory: you collect real usage moments instead of reconstructed averages. Tooling, incentives, and analysis add up. Ping 3–5 times per day for 1–2 weeks, and keep each response under 1 minute or compliance collapses. Trigger pings on events (app opened, task abandoned) when possible; random beeps land on many irrelevant moments. Scores: breadth 5, depth 6, remote 5, cost 6. Value: 10. Both qualitative and quantitative; both behavioral and attitudinal.

17. Concept Testing. Show target users an early concept (a sketch, storyboard, landing page, or value proposition) and measure comprehension and demand before writing code. Killing a weak idea at the sketch stage is the cheapest money a product team ever saves. One warning: stated interest always overstates real adoption. Test 2–3 concepts against each other; people are polite to a lone idea and honest when forced to choose. Probe comprehension first, because a concept nobody can explain back is already dead. Scores: breadth 4, depth 6, remote 5, cost 5. Value: 10. Both qualitative and quantitative; attitudinal.

18. Churn Interviews. Interviews with customers who just canceled, downgraded, or walked away from the product. Nobody explains product-market fit gaps better than someone who left, and the recency keeps memories sharp. Recruiting is the hard part: departed customers owe you nothing, so pay them well. Interview within 2–4 weeks of cancellation and hunt for two facts: the trigger moment, and what the customer now does instead. Leaving for a rival and leaving the category demand different fixes. Scores: breadth 3, depth 6, remote 5, cost 4. Value: 10. Qualitative; attitudinal.

19. Smoke Tests. Run ads to a landing page that describes a product or feature that doesn’t exist yet, and measure who signs up. The method tests demand with money (your ad spend) against behavior (their signups), which beats asking people whether they’d hypothetically buy. Findings apply to the pitch, not the product. Escalate the commitment you ask for: an email address is weak evidence, a refundable deposit is strong. And say plainly that the product is still in the works, because demand built on deception evaporates at launch. Scores: breadth 3, depth 6, remote 5, cost 4. Value: 10. Quantitative; behavioral.

20. Beta Testing. Releasing a near-final product to real users in real conditions before general availability. Betas surface configuration chaos, edge cases, and early product-market fit signals that no lab can simulate. Findings arrive late in the development cycle, so most fixes will be small ones. Recruit engaged testers and make giving feedback effortless. Instrument the beta build with telemetry plus a 1-click report button, and triage the intake weekly, or the stream rots. Segment testers deliberately: power users find depth problems, novices find onboarding problems. Scores: breadth 6, depth 5, remote 5, cost 6. Value: 10. Both qualitative and quantitative; both behavioral and attitudinal.

21. Dogfooding. Employees use their own product in daily work and report what breaks and what grates. It’s nearly free, it runs continuously, and it catches rough edges before customers meet them. But you ≠ user: employees know too much, forgive too much, and never behave like novices. Treat dogfooding as a bug net, and keep doing research with real users. Make reporting effortless (a dedicated channel, a screenshot hotkey), and get executives dogfooding too; nothing funds a fix faster than a vice president hitting the bug. Scores: breadth 5, depth 3, remote 5, cost 3. Value: 10. Qualitative; both behavioral and attitudinal.

22. In-App Feedback Widgets. Always-available feedback buttons, thumbs ratings, and comment boxes embedded in the product. The widgets harvest a steady stream of complaints, praise, and bug reports at almost no cost. Self-selection skews the stream toward the annoyed, so read it as an alarm system, not a measurement. Capture context automatically (page, account state, last action); “it doesn’t work” without context is noise. Place widgets at task-completion moments, where memory is freshest. Scores: breadth 4, depth 3, remote 5, cost 2. Value: 10. Both qualitative and quantitative; attitudinal.
23. Field Observation. Also called shadowing or fly-on-the-wall research: the researcher watches users work in their natural environment without interrupting. Pure observation catches what people would never think to mention and what they’d stop doing if questioned mid-task. You see the behavior but must infer the reasoning. Travel and patience required. Write down actions while watching, and save every why for a short debrief afterward, when questions can no longer change the behavior you came to see. Scores: breadth 7, depth 7, remote 2, cost 7. Value: 9. Qualitative; behavioral.
24. Fake Door Testing. Add a button or menu entry for a feature that doesn’t exist, count who clicks, and show a polite “coming soon” message with an early-access signup. The clicks measure real demand through real behavior before engineering commits a sprint. Use it sparingly: every fake door spends a little user trust. Set the success threshold before launch, expose the door to a small slice of traffic, and run at least 1 full weekly cycle before judging demand. Scores: breadth 2, depth 5, remote 5, cost 3. Value: 9. Quantitative; behavioral.
25. Research Communities. A standing panel of opted-in users you can survey, test, and interview repeatedly, often through a dedicated platform. Communities collapse recruiting time from weeks to days, which changes how often teams run research at all. The risk: members turn into professional respondents who know your product too well. Refresh the membership regularly. Cap each member at 1 study per month, track tenure, and retire veterans after 1–2 years; freshness is the panel’s whole value. Scores: breadth 6, depth 4, remote 5, cost 6. Value: 9. Both qualitative and quantitative; both behavioral and attitudinal.
26. Hallway Usability Testing. (Also called “guerrilla research.”) Intercepting people in a café or an office lobby for a 5–10-minute test in exchange for a coffee. It’s nearly free and delivers same-day findings. The convenience sample rules out specialized user groups and complex tasks, so save it for consumer products and rough prototypes. Pick a spot your audience frequents, arrive with the prototype preloaded, and keep consent to 1 page; speed is the whole point of the method. Scores: breadth 5, depth 4, remote 2, cost 2. Value: 9. Qualitative; behavioral.
27. True Intent Studies. A random sample of live-site visitors answers two questions: what they came to do (asked on arrival) and whether they succeeded (asked at exit). The method connects visit purpose to outcome at scale, exposing your real task distribution and its failure rates. Remember that self-reported success is generous. Invite a true random sample, run for 1–2 weeks to smooth daily swings, and report by intent group, because averages across different purposes mean nothing. Scores: breadth 4, depth 4, remote 5, cost 4. Value: 9. Quantitative; attitudinal.
28. Keyword Research. Analysis of external search demand: what the market types into Google, or asks an AI chatbot, about your product category. Query volumes reveal user vocabulary and unmet demand before those users ever reach your site. SEO teams own the tools; UX teams should borrow the data. Mine the question-phrased queries for content ideas, and compare branded against unbranded volume: the gap measures how many potential buyers don’t know you exist. Scores: breadth 3, depth 4, remote 5, cost 3. Value: 9. Quantitative; behavioral.
29. Search Log Analysis. Analyzing what users type into your product’s internal search box. The logs reveal user vocabulary, unmet content demand, and navigation failures, because people search for what they can’t find. A narrow method with an outsized payoff for information architecture and content strategy. Review the top queries and every zero-results query monthly: add synonyms for the mismatches, and rename navigation labels to the words users actually type. Scores: breadth 3, depth 4, remote 5, cost 3. Value: 9. Quantitative; behavioral.
30. Intercept Surveys. Short questionnaires triggered inside the live product at a relevant moment (“What brought you here today?”). Intercepts capture intent while it’s fresh, which email surveys and exit interviews can’t. Keep them to 1–3 questions; every additional field multiplies abandonment and annoyance. Fire the invitation after task completion, cap it at 1 appearance per user, and suppress recent respondents, or the sample becomes the same few enthusiasts. Scores: breadth 4, depth 3, remote 5, cost 3. Value: 9. Quantitative; attitudinal.
31. Concierge Testing. Deliver the service manually to a handful of customers: a human performs what software would eventually automate. You learn exactly what customers need, in what order, and with what exceptions, because you’re the one doing the work. Labor-intensive by design. If the manual version delights nobody, the automated version won’t either. Scores: breadth 4, depth 8, remote 3, cost 7. Value: 8. Qualitative; both behavioral and attitudinal.
32. Wizard of Oz Testing. Users interact with a system that doesn’t exist yet: a hidden human plays the machine behind the curtain, generating responses live. The method tests demand and interaction design for expensive functionality (AI features especially) before a single line of code exists. Setup takes effort, and the wizard needs rehearsal. Scores: breadth 4, depth 7, remote 3, cost 6. Value: 8. Qualitative; behavioral.
33. Competitive Usability Testing. The same participants perform the same tasks on your product and on 1–2 competitors. Jakob’s Law says users spend most of their time on other sites, and nothing recalibrates a team faster than watching customers succeed on a rival’s design. Costs multiply with every product tested, but the strategic payoff is real. Scores: breadth 5, depth 6, remote 4, cost 7. Value: 8. Qualitative; behavioral.
34. Card Sorting. Users group content items into categories that make sense to them, either freely (open sort) or into your proposed buckets (closed sort). The result maps users’ mental categories, which is exactly what an information architecture should mirror. Online tools have made it almost free. Narrow, but crisp. Scores: breadth 2, depth 4, remote 5, cost 3. Value: 8. Both qualitative and quantitative; attitudinal.
35. First-Click Testing. Show a screen, state a task, and record where people click first. In my experience, users who start down the right path usually finish the task, while users who start wrong rarely recover. Thus a failed first click flags a design problem worth fixing before anything else. Cheap, fast, and narrow. Scores: breadth 2, depth 3, remote 5, cost 2. Value: 8. Quantitative; behavioral.
36. Participatory Design Workshops. Users co-create solutions with the design team through structured exercises: sketching, card games, and scenario building. The workshops generate ideas, surface priorities, and build stakeholder buy-in. Users aren’t designers, though. Treat their sketches as statements of need, not as blueprints. Scores: breadth 5, depth 5, remote 3, cost 6. Value: 7. Qualitative; attitudinal.
37. Accessibility Testing. Usability testing with participants who have disabilities, working through their own assistive technologies: screen readers, switch controls, magnification, voice input. Remote sessions often beat lab visits because participants keep their customized setups. The findings tend to be severe and structural, the fixes help everybody, and the legal exposure shrinks. Specialist recruiting raises the cost. Scores: breadth 4, depth 5, remote 4, cost 6. Value: 7. Qualitative; behavioral.
38. Desirability Testing. Participants pick words from a controlled vocabulary of reaction cards (Joey Benedek and Trish Miner built the original 118-word set at Microsoft in 2002) to describe a design. The method quantifies emotional response and brand perception, which task metrics miss entirely. Narrow, cheap, and quick. Scores: breadth 2, depth 3, remote 5, cost 3. Value: 7. Quantitative; attitudinal.
39. Tree Testing. A reverse card sort: users locate items in a text-only version of your category structure, stripped of all visual design. Tree tests isolate whether the information architecture works before navigation design can mask its failures. Precise, fast, and inexpensive. Scores: breadth 2, depth 3, remote 5, cost 3. Value: 7. Quantitative; behavioral.
40. Heatmap Analysis. Aggregated visualizations of clicks, taps, and scrolling across thousands of visits. Heatmaps show what gets noticed, what gets ignored, and where users click on things that aren’t links (false affordances, a gift for any redesign). They describe attention without explaining it, and they’re easy to over-interpret. Scores: breadth 3, depth 2, remote 5, cost 3. Value: 7. Quantitative; behavioral.
41. Standardized UX Questionnaires. Validated instruments such as the System Usability Scale (SUS) or UMUX-Lite produce a single benchmarkable score you can track across releases. The number tells you whether perceived quality moved. It won’t tell you why, and sampling shifts can move the score more than the design did. Scores: breadth 3, depth 2, remote 5, cost 3. Value: 7. Quantitative; attitudinal.
42. Five-Second Test. Show a page for 5 seconds, then ask participants what they remember and what they think the product does. The test measures first impressions and value-proposition clarity, nothing more. Since users grant a new page only 10–20 seconds before deciding to stay or leave, that clarity is worth checking. Scores: breadth 2, depth 2, remote 5, cost 2. Value: 7. Qualitative; attitudinal.
43. Preference Testing. Show 2 or more design variants and ask which one users prefer and why. Stated preference correlates weakly with actual performance, so never let it overrule task data. As a quick directional signal on visual style, it’s fine. Scores: breadth 2, depth 2, remote 5, cost 2. Value: 7. Quantitative; attitudinal.
44. A/B Testing. Randomly split live traffic between design variants and measure which one wins on a target metric. It’s the only method on this list that proves causation at scale, and that’s genuinely valuable. But it answers narrow questions, explains nothing about why the winner won, demands substantial traffic, and quietly traps teams into climbing a local maximum, one button color at a time. Scores: breadth 4, depth 3, remote 5, cost 6. Value: 6. Quantitative; behavioral.
45. NPS and CSAT Tracking. Recurring 1-question loyalty and satisfaction surveys (“How likely are you to recommend us?”). The scores are easy to collect, easy to chart, and beloved by boards. As research, they’re thin: a number moves, and nobody knows why. Track them if management insists, but never confuse the metric with insight. Scores: breadth 2, depth 2, remote 5, cost 3. Value: 6. Quantitative; attitudinal.
46. Focus Groups. A moderator leads 6–10 people through a group discussion of needs, reactions, and concepts. Groups produce vocabulary and attitudes quickly, and marketing departments love them. For product development they’re treacherous: dominant personalities steer the room, conformity smothers dissent, and you learn what people say, not what they do. Watch users, not discussions. Scores: breadth 5, depth 3, remote 3, cost 7. Value: 4. Qualitative; attitudinal.
47. Usability Benchmarking. Large-sample quantitative measurement of success rates, task times, and errors, compared against earlier releases or competitors. Executives love a tracked number, and benchmarks settle arguments. But the studies are expensive and statistically demanding. You’ll know the score moved. You won’t know why. Scores: breadth 4, depth 3, remote 4, cost 8. Value: 3. Quantitative; behavioral.
48. Multivariate Testing. A/B testing’s expensive cousin: vary several page elements simultaneously and test the combinations against each other. Multivariate testing needs enormous traffic to reach statistical significance and mostly discovers small interaction effects among small tweaks. If you have the traffic of Amazon, fine. If not, run sequential A/B tests instead. Scores: breadth 3, depth 2, remote 5, cost 7. Value: 3. Quantitative; behavioral.
49. Eyetracking. Specialized hardware records where the user’s gaze lands, fixation by fixation. Eyetracking produced some of the field’s most famous findings about how people read online (including mine), and it retains real value in academic research. For product teams, it’s the ultimate prestige method, the Fabergé egg of UX research: costly equipment, specialist analysis, and conclusions that cheaper methods usually reach first. Attention isn’t comprehension. Spend the money on 10 extra usability sessions instead. Scores: breadth 3, depth 4, remote 2, cost 9. Value: 0. Quantitative; behavioral.
Eyetracking is the Fabergé egg of UX research.
50. Biometric Testing. Sensors record physiological responses during product use: facial-expression coding, galvanic skin response, sometimes electroencephalography (EEG). The gear measures arousal, not meaning: you learn that something happened emotionally, rarely what or why. It’s a seismograph for emotions: every tremor registered, none explained. Add expensive hardware, scarce analysts, and lab conditions, and you get the ranking’s sole negative value. Leave it to the research labs. Scores: breadth 2, depth 3, remote 2, cost 9. Value: −2. Quantitative; behavioral.
Conclusion: Stack the Cheap Methods, Ration the Prestige Ones
A default research program falls straight out of the table. Run the top 4 continuously: moderated usability testing, user interviews, product analytics, and unmoderated testing. Together they cover discovery, evaluation, and monitoring for roughly the cost of a single eyetracking study, and they balance the tags too: qual and quant, behavior and attitudes.
Add a deep field method (contextual inquiry, or full ethnography when the stakes justify it) once a year to catch the strategic surprises that quick methods can’t reach. And treat the bottom of the table as specialty instruments: reach for multivariate testing, eyetracking, or biometric sensors when their narrow question is exactly your question, not because the hardware looks impressive.
Disagree with a score? Good. Adjust the numbers for your product, your team, and your budget, then re-sort the list. The spreadsheet takes 5 minutes. The arguments it settles would have taken 5 meetings.

We have a rich toolbox of user research methods to choose from: one for every project. If this is too much for you, start with moderated usability testing. (All images in this article made with GPT Image 2)


