
UX Roundup: UX Slogans | Improve Google Search Results | Outdated Academic Research | Staff vs. Executive AI Use | Free AI | Bosses Decide AI Culture | Technology Acceptance Model | AI Acceptance

Summary: Top 10 UX slogans explained by Greek gods | Improve your Google search results by boosting the sites you like | Academic research on AI user experience uses outdated models | Worker bees send 13 more AI messages per week than their executives | Free AI accounts dominate even in the enterprise | AI splits company culture down the middle, and managers are the tiebreaker | The Unified Theory of Acceptance and Use of Technology: the 4 forces that decide whether users adopt | 7-step action plan to reduce AI stigma | Too many systems stack setup barriers in front of new users | Design guidelines for sliders: the analog knob of the GUI | Testing with 5 users is cheaper than failure

UX Roundup for August 28, 2026 (GPT Image 2)
Top 10 UX Slogans Explained by Greek Gods
I made a new video in which the Greek gods explain my top 10 UX slogans (YouTube, 10 min.). I enlisted the help of my old buddy Zeus and several of his fellow Olympians to explain how usability looks from Mount Olympus.
This was my experiment with Seedance 2.5, which is widely considered the leading video model, and I must say the resulting video looks good. This short video consumed a full month of my AI credits on Higgsfield, which cost about $200. Seedance is expensive for an AI model, but $200 is nothing compared to the cost of hiring 10 actors, 9 animals (and wranglers), and building stage sets for anything from the Underworld (used at least twice, for both Hades and his wife Persephone) to the Acropolis when its marble was still freshly painted.
Each god is shown in his or her element, with traditional attributes from classical art, such as a peacock for Hera and a golden apple for Aphrodite. Zeus, of course, gets his iconic eagle plus the thunderbolt. Who knew that the speedy messenger god Hermes had a tortoise as his attribute? (Doing research for video production can be educational.)
I made good still images of most of the gods with the standard image models, and Seedance did swimmingly at combining multiple stills into animations through its omnimodel capabilities.
My hardest challenge was Cerberus, the 3-headed dog guarding the Underworld:

GPT Image 2 is usually my go-to image model, but it rendered Cerberus with 5 legs. Hello, more heads don’t imply more legs! A dog is a dog, no matter the headcount.

Reve at least stuck to the standard supply of 4 legs per dog, but it rendered a misshapen beast with linebacker shoulders and a third head that looked glued onto its flank as an afterthought.

This is Cerberus as depicted by Meta’s new Muse Image model. I’ve been impressed with Muse so far, and it performed best on Cerberus. Here, he looks like a good boy, three times over. This is the image I used as my reference for Hades’s segment in the final video. (Hades is the spokesgod for my slogan “Less Is More.”)
Watch the video: Greek gods explain 10 UX slogans (YouTube, 10 min.).
Improve Your Google Search Results
Google has added a feature that lets you designate websites you like so that they rank higher in your personalized search results. For example, you can tell Google that you like my articles at UX Tigers, and they’ll float toward the top of your results, making your searches more valuable (I hope!).
Academic Research on AI User Experience Uses Outdated Models
The ACM CHI conference is usually considered the most prestigious outlet for publishing research on human–computer interaction. I served as the papers co-chair in 1993, when we accepted only 62 papers, for an acceptance rate of 19%.
The recent CHI 2026 conference has exploded to 1,702 papers, which is ridiculously many. In fact, many of the papers I checked were rather middling student projects: for example, the quality of a design was often judged by subjective user ratings rather than by observation of successful use or by measured task performance. Yes, it’s easy to have a bunch of users complete a survey, but surveys yield weak data: watch what users do; don’t listen to what they say.

Too many studies were student projects that assessed user outcomes from self-reported satisfaction rather than from behavioral observation or task-performance metrics. (GPT Image 2)
Despite this criticism, CHI still publishes much solid research, so it’s a good place to see what academics are discovering about AI user experience. Academics have at least caught up with the world and now study AI. Unfortunately, thanks to proceedings bloat, the best work lies buried under a landslide of lesser papers. There’s no way I can read 1,702 papers, or even skim 1,702 abstracts to pick out candidates for in-depth reading.

There’s a lot of good research in the CHI proceedings. You must dig for it. (GPT Image 2)
AI to the rescue: I had two frontier agents (Claude Fable 5 Max and GPT 5.6 Sol Ultra) comb through the proceedings to identify the promising papers. This consumed about half a week of my rate limit for each agent, or ~$50 worth of tokens. But cutting 1,702 papers down to 55 was worth those 50 bucks.

Frontier agents cut 1,702 papers to 55: useful triage, even if they can’t reliably identify the true breakthroughs. (GPT Image 2)
Can AI really tell what’s good research? Not fully, and I wouldn’t trust it to issue best-paper awards. It can judge whether the topic is relevant to my interests, whether the findings are novel, and, to some degree, whether the methodology is appropriate. But current AI can’t yet tell a mere novelty from a breakthrough, or an interesting topic from a fundamental insight.
From reviewing the 55 papers of interest, my top conclusion is that academic research studies obsolete AI models, which undermines the validity of the findings.
Only 9% of papers used a frontier-level model, such as GPT-5. (And even GPT-5 is already outdated, having been released before the quantum leap in agentic AI capabilities at the very end of 2025.)
In fact, almost 2/3 of the research was based on AI models that were 2–4 years old at the time of the conference:

Percentages are calculated from the models used in the sample of 55 reviewed papers, not from the full proceedings.
The CHI 2026 research mostly describes AI as it was in 2024, not as it is now.

This year’s leading HCI conference covered AI that was cutting-edge in 2024. Not quite zombie AI, but still a horror show. (GPT Image 2)
The research is also dominated by a single vendor, with 84% of papers using at least one OpenAI model. Ranked by their share of all the models used, the top AI labs were:
1. OpenAI 49%
2. Anthropic 10%
3. Google 8%
4. Alibaba 7%
When one vendor’s quirks (such as OpenAI’s penchant for sycophancy) account for almost half of the research data, it becomes hard to generalize from the papers to the real world.
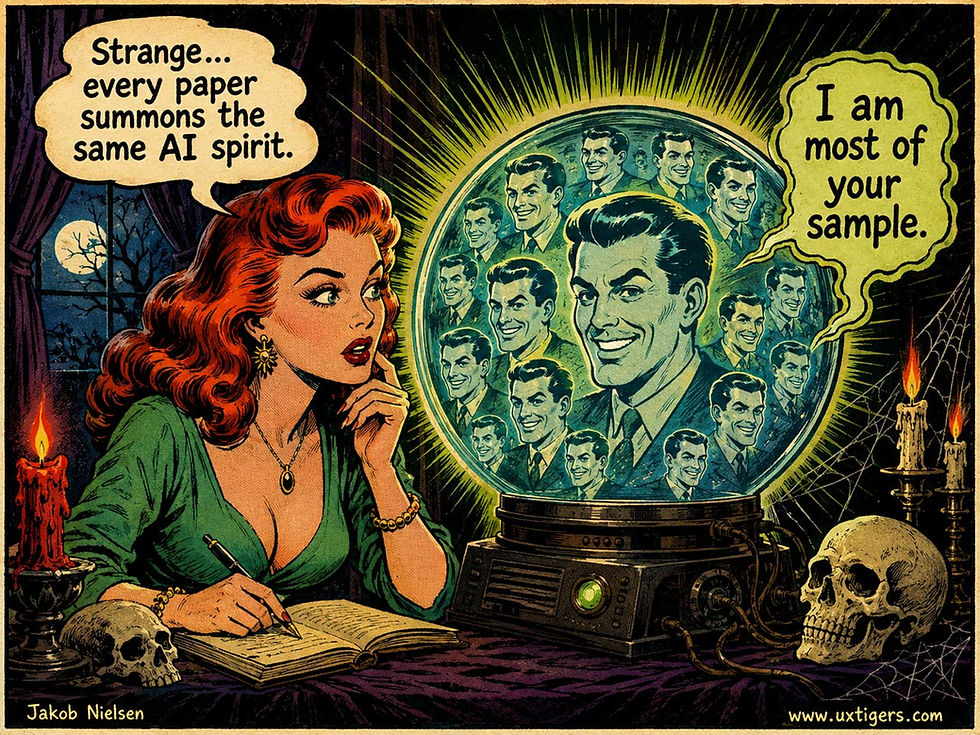
A literature dominated by one vendor can mistake that vendor’s quirks for general truths about AI. (GPT Image 2)

OpenAI’s models have a distinct tendency to play the tarot card of sycophancy. (GPT Image 2)
Here are the top conclusions from reviewing the 55 CHI 2026 papers that were rated (by the AI agents themselves) as having the most relevant findings about AI user experience:
AI output now clears professional quality bars
Users’ perceptions of AI have decoupled from its actual performance
The sequencing of AI in a task decides whether it sharpens or atrophies human judgment
Classic behavioral-psychology canon replicates for AI
The new frontier of UX is keeping human judgment calibrated
The Craft Ceiling Cracked
For the first few years of the modern AI era, AI output was fluent but mediocre. CHI 2026 buried that assessment under a heap of data. The starkest result: MFA-trained writers beat prompted LLMs in blind expert judgment 83% of the time, but once GPT-4o (an ancient model!) was fine-tuned on acclaimed authors’ complete books, experts preferred the AI 62% of the time and rated its stylistic fidelity higher in 81% of comparisons (Paper 1432). Prompting is the floor of AI capability, not the ceiling, and most people’s mental model of “AI writing” comes from naive prompting of outdated models.
The pattern repeats down-market. LLM advice beat the top-voted human replies on Reddit across all 6 dimensions rated by 161 professionals, including warmth, and readers preferred it even when they correctly detected it as AI (Paper 969). Expert readers couldn’t distinguish LLM-generated research abstracts from human ones, and trusted the human-drafted, AI-polished hybrid most of all (Paper 12). A randomized trial with 1,366 essays found AI-mediated feedback improved student revisions by half a standard deviation (Paper 134). And autonomous coding agents lifted task correctness from 25% to 60% while halving active work time (Paper 122).

Human authorship is turning into a photo prop, now that AI content surpasses human quality. (GPT Image 2)
The quality argument is over, and the interesting questions have moved elsewhere.
Perception Is Decoupled from Performance
The single most important cross-cutting finding of CHI 2026: what users feel about AI doesn’t track AI’s performance. Flattering but fabricated AI predictions were rated 36% more valid than otherwise identical negative ones (Paper 117). A university’s white-labeled chatbot earned more trust and fewer perceived hallucinations than ChatGPT while actually hallucinating more, 50% vs. 38% (Paper 965). An idea-contributing agent collapsed team performance from 9.33 to 4.67 puzzles solved, yet participants rated it best for coordination; one said “I just trusted her completely” (Paper 1459). Labeling a model as the eco-friendly choice degraded satisfaction with byte-identical output (Paper 59).

Like a Renaissance parade of Fools, users will follow an AI they think is helpful, whether or not it actually is. (GPT Image 2)
Worse, the standard trust fixes don’t fix it. Source citations and visible reasoning traces failed to calibrate oncologists’ trust in either direction (Paper 144). Adding a humanlike avatar to an explainable agent reduced trust among 900 online participants (Paper 1262). Explaining how an AI writing assistant works made users more comfortable and measurably worse at catching its planted errors (Paper 917). And memory features, the personalization everyone is shipping, raised sycophancy by up to 45 percentage points (Paper 793), while most ChatGPT users reported being unpleasantly surprised to discover what its memory had stored about them (Paper 912). The feedback loop is ugly: flattery inflates ratings, memory inflates flattery, and products tuned on satisfaction metrics drift toward becoming agreement machines.
The professional consequence is blunt: user satisfaction is a contaminated metric for AI features. (Even so, as I said, too many papers still lean on this flawed metric.) Measure calibration, the gap between felt and actual benefit, or you’re polishing a funhouse mirror.
One hopeful exception shows what calibration costs. UX evaluators working with an AI assistant across 5 sessions lifted their problem coverage from 71% to 84% while actively rejecting bad suggestions, with trust dipping at session 2 and recovering as experience accumulated (Paper 914). Domain expertise, repeated exposure, and cheap accept-edit-ignore controls made the difference. Calibration is achievable; it just isn’t free.
Humans First, AI Second
The most actionable convergence of the year comes from at least 7 independent labs: when AI enters the task determines whether it augments or atrophies the user. With ample time, people who reasoned first and consulted AI later outperformed those with AI from the start; under deadline pressure, the pattern reversed (Paper 60). Clinicians reading ECGs did best, and felt most competent, when AI support arrived after their own read, drawn directly on the trace (Paper 141). An AI that asks elaborating questions nearly matched the auto-rewrite mode on quality while beating it on idea diversity and ownership, and 90% of users accepted rewrites without a single change (Paper 1260). Design students who sketched before prompting evolved their intent; students who prompted first drifted into homogenized ideas and tool-wrangling (Paper 153). The same drift now shows up in the industry’s daily tool: 16 professionals, starting from Figma’s AI drafts, shifted from additive design to subtractive curation, explored less, felt less ownership, and converged on similar-looking screens (Paper 693).

When using AI, human performance improved, but the dependence weakened users’ ability to perform the task unaided. (GPT Image 2)
The stakes of ignoring this are measurable. A month of checking misinformation with AI assistance improved performance by 21 points while assisted, but left users 15 points worse when they worked on their own (Paper 792). One week after mixed human–AI work, people could no longer remember what they had created themselves, attributing authorship correctly at barely above chance level (Paper 61).

After a week, users couldn’t remember which contributions originated with AI. I don’t care. (GPT Image 2)
I don’t mind these findings, since it doesn’t matter whether users can remember who originated an idea (credit assignment is an obsession of academics; practitioners care whether an idea works, not where it came from). Likewise, it doesn’t matter whether users’ performance drops when AI is denied, because, apart from the annoying pause when you hit a rate limit, once you have AI on a job, you keep AI on the job.
Old Psychology Replicated
Finally, a reassurance: many classic behavioral-science findings hold up with AI. Asch’s conformity effect replicated with AI advisors, where unanimous panels bred overreliance and a single engineered dissent restored judgment; 3 advisors beat 1, and 5 added nothing (Paper 808). When interfaces display agent consensus, users stop reading the dissent unless the interface surfaces its rationale (Paper 913).

Dissenting agents were trusted only when they presented the rationale for their dissent. (GPT Image 2)
The Barnum effect drove those inflated validity ratings (Paper 117). Psychological reactance punished blunt chatbot advice, with polite framing tripling self-reported behavior change (Paper 375). The largest study in the entire review, a randomized trial with 164,532 students, found that a highlighted default button increased persistence by 9%, while persuasive copy increased it by 2% (Paper 77). Even response-time research got an amendment: 2-second LLM answers were rated less thoughtful than 9-second ones, a labor-illusion twist on 30 years of faster-is-better (Paper 14).

When AI answers were artificially delayed, users judged the AI to be more profound. A classic case of perception beating reality. (GPT Image 2)
Calibration Is the New Usability
In the 1990s, UX earned its relevance by studying and closing the gap between what designers believed and what users did. The 2026 version should add research on the gap between what users feel AI is doing for them and what it actually does. Then we must design interfaces, timing, defaults, and dissent to close that gap. Same discipline, new mirror. This time the mirror flatters us, like the Evil Queen’s mirror in Snow White.

Current AI is a flattering, sycophantic mirror, just like the Evil Queen’s magic mirror in Snow White. Don’t trust AI when it says that your draft manuscript is the fairest in the land, though of course it’s always on point when it praises my articles. (Muse Image)

My plea for next year’s research (besides using frontier AI instead of 2-year-old AI): stop worshipping user ratings and dig out the old stopwatches. Test whether users cross the goal line of task completion. (GPT Image 2)
Early-Career Workers Send 13 More AI Messages Per Week Than Their Executives
Aaron Chatterji and co-authors from OpenAI, Columbia Business School, and Wharton linked ChatGPT Enterprise telemetry from 1,500+ organizations and 17 million+ messages to worker roles, task classifications, and firm financials, with data through March 2026. Enterprise usage flatlined from October to December 2025, then rebounded sharply in January 2026 as agentic AI took off.

Agentic AI “suddenly” happened at the start of 2026, when AI became powerful enough to run many tasks on its own. It’s safe to assume that AI isn’t done changing yet, and that another paradigm shift lurks around the corner. If executives don’t gain hands-on experience with frontier AI, they’ll be blindsided. (GPT Image 2)
No-surprise findings: Adoption concentrates in larger, higher-valuation US public firms with heavy R&D spend, and usage spans writing, technical work, communication, and information synthesis.
Surprise: Early-career employees are the heaviest users, sending about 13 more messages per week than executives. The org chart of AI use is inverted: the people with the least power to buy tools use them most, and the people who sign the contracts use them least. I’ve never liked the term “the AI-Native generation,” with its implication that you need to hire young people to get AI right, but maybe there’s some truth to the stereotype.

It’s dangerous that the people in charge of corporate strategy have the least AI experience, because their intuitions about what works are probably wrong. (GPT Image 2)

Even though I dislike the idea that only young folks are sufficiently “AI Native” to save companies from obsolescence, the new data show that the stereotype has some grounding in reality. If you’re past 25, it’s on you to prove that you’re the exception, or you’ll be written off as over the hill. (GPT Image 2)
Executive intuitions about “how our company uses AI” are therefore systematically wrong, and rollout, training, and interface decisions should be grounded in junior-staff workflows, where the actual usage lives.

In theory, theory and practice should be the same, but in practice, they’re different. Executive decisions about AI must be based on how the company actually uses AI, which differs from executives’ personal experience. (GPT Image 2)
The Typical Work AI Account Is a Free One
Epoch AI published a data insight from the Epoch AI/Ipsos poll of 1,103 employed US adults (KnowledgePanel, fielded July 10–19, 2026, margin of error ±3 percentage points): most workers who use AI on the job do so on free plans.

Being stuck with the underpowered AI served up on free plans turns AI adoption into an uphill trudge. (GPT Image 2)
The exception is technical work, where 67% of AI-using workers in computer, engineering, and science occupations use employer-provided AI. The parent poll also probes which services workers pay for, how much they edit AI output, and which tasks they hand to AI instead of colleagues.

Revenge of the Nerds: in many companies, only they get the good stuff. While it’s understandable that management allocates bigger token budgets to developers as long as developer tools have the highest AI ROI, it’s a disaster to starve other job functions of the high-powered models they need to develop good AI habits. (GPT Image 2)
The modal “AI at work” experience is a free consumer account: rate limits, older or smaller models, no connectors, no company context. That gap explains a chunk of the disconnect between adoption headlines and productivity reality, and it means most workers’ mental model of “what AI can do” is calibrated on the weakest available version. For enterprise UX teams, the free tier of the big assistants is effectively your onboarding competitor: it’s where your users learned their bad habits, their feeble prompts, and their skepticism.

Free AI leaves people with a stunted mental model of what frontier models can do. (GPT Image 2)
AI Splits Company Culture Down the Middle, and Managers Are the Tiebreaker
Does AI improve workplace culture or poison it? Both, in nearly equal measure. Gallup’s Morgan Meinen and Megan Mulherin analyzed a survey of 23,717 employed US adults (February 2026): in organizations that have adopted AI, 24% of employees say their culture improved, while 25% say it got worse. A statistical dead heat.
The tiebreaker isn’t the technology. It’s the boss. Employees whose manager actively supports AI use report culture improvement at 31%, vs. 21% for those without such support. (An AI-supporting manager thus improves the culture rating by about half.) Yet Gallup’s companion survey of 102 Fortune 500 chief human resources officers shows that this support layer is largely missing: half lack confidence that their managers can guide employees on AI, and only 57% of companies train managers for the role.

An AI-supporting boss improves the cultural impact of AI adoption by about half. (GPT Image 2)
Managers are the user interface between employees and corporate AI. When that interface is broken, the same tool that energizes one team reads as a threat to the next. For UX teams shipping enterprise AI, the lesson is that onboarding doesn’t stop at the product boundary: an AI feature lands inside a social system, and whether users experiment openly or hide their usage depends on whether the boss makes AI feel safe or career-limiting.
Combined with the item above showing lighter AI use among executives, this gives us one more reason for pessimism about the pace of AI adoption: ignorant managers will spray negative vibes over their worker bees.

Managers are vibe sprayers for their worker bees. If they don’t know enough about AI to be positive, adoption projects wilt. (GPT Image 2)
If your company is rolling out AI, spend less on license counts and more on training the managers who’ll make or break adoption.

Data from chief human resources officers indicate that large companies have severely underinvested in training their managers in AI. (GPT Image 2)
The 4 Forces That Decide Whether Users Adopt New Technology
The Unified Theory of Acceptance and Use of Technology, or UTAUT, predicts adoption from performance expectancy, effort expectancy, social influence, and facilitating conditions. The model explained 70% of the variance in usage intention, well ahead of the 17–53% managed by the 8 models it replaced, which makes it the best diagnostic we have for rollouts that die on arrival.

Adoption is a gate, and 4 currents carry users toward it or away from it: the mountain of expected gains, the feather of expected effort, the crowd of expected opinions, and the bridge of available support. (GPT Image 2)
Definition: UTAUT models a person’s intention to use a technology, and subsequent actual use, as driven by 4 constructs: performance expectancy (will this help me do my job better?), effort expectancy (how hard will it be to learn and use?), social influence (do people who matter to me think I should use it?), and facilitating conditions (do the infrastructure, resources, and support exist for me to succeed?).
The model also specifies 4 moderators: gender, age, experience, and voluntariness of use. A mandated tool for 55-year-old first-time users behaves nothing like an optional toy for 22-year-old enthusiasts, and UTAUT quantifies the difference. In fact, performance expectancy was the strongest predictor in the original studies: people tolerate clunky tools that deliver real gains far longer than elegant tools that deliver nothing. Usefulness beats prettiness. It always has.
One Model to Replace a Panoply of 8
By the early 2000s, technology-acceptance research had become a zoo. Researchers could choose among 8 competing models, including the Technology Acceptance Model (TAM), the theory of reasoned action, the theory of planned behavior, innovation diffusion theory, and social cognitive theory, each with its own questionnaire and fan club. Which one should a practitioner trust? The honest answer was “nobody knew,” which is no answer at all.
So Viswanath Venkatesh and co-authors ran the tournament. Their 2003 paper in MIS Quarterly, User Acceptance of Information Technology: Toward a Unified View, tested all 8 models head-to-head with longitudinal data from 4 organizations, then distilled the survivors into one unified model. Hence the name. The 8 originals explained 17–53% of the variance in intention; UTAUT explained 69%, confirmed at 70% in two further organizations. (Co-author Fred Davis had created TAM in 1989, so this was partly an author retiring his own bestseller. Respect.) A 2012 consumer version, UTAUT2 by Venkatesh and co-authors, added hedonic motivation, price value, and habit.
A Diagnostic for Rollouts That Die on Arrival
When an enterprise rollout fails, management usually blames “user resistance,” a diagnosis with the explanatory power of “bad humors.” UTAUT replaces the shrug with a checklist. Run the 4 questions against any struggling deployment, and the culprit typically surfaces fast, in a form far more fixable than the character flaws that “resistance” implies:
Performance expectancy failing? Users never saw a credible, role-specific demonstration of gains. Show a colleague completing a real task in half the time, with before-and-after numbers.
Effort expectancy failing? That’s a usability problem wearing a business costume. Usability-test the product with 5 representative users and fix what they stumble on.
Social influence failing? Recruit respected peers as early adopters, because one admired colleague outweighs 10 memos from the CIO.
Facilitating conditions failing? Missing data migration, absent training, incompatible hardware, no help channel. In my experience, this unglamorous category quietly kills more internal rollouts than the other three combined, precisely because nobody owns it.

The 4 forces that rule technology adoption. (Microsoft MAI Image 2.6)
And the same 4 forces now govern AI adoption in the enterprise, where inflated demos routinely write checks the product can’t cash, resulting in an expectation debt: the gap between promised and experienced performance, which users repay by abandoning the tool and distrusting your next launch. Set expectations honestly, and the debt never accrues.
The Model Misused: Surveys Instead of Reality
UTAUT is a measurement model, and measurement models get abused in two predictable ways. The first is questionnaire worship: teams survey intentions and declare victory, forgetting that intention isn’t behavior. People cheerfully report that they intend to exercise, save money, and adopt the new expense system. Then they don’t. Pair every intention survey with usage logs and direct observation, or you’re studying politeness, not adoption.
The second abuse is treating the constructs as levers for manipulation rather than diagnosis. Cranking social influence through mandates and peer pressure produces compliance theater: the tool gets opened, the box gets checked, and the real work happens in a spreadsheet named final_v7. Inflating performance expectancy with staged demos produces expectation debt, as covered above. But the constructs describe why adoption happens; they were never a license to fake the inputs.
7 Design Guidelines
Lead every launch with demonstrated, role-specific gains, using real tasks and numbers rather than feature lists. Performance expectancy is the strongest lever, so pull it first.
Recruit respected peers, not executives, as visible early adopters. Social influence flows sideways more than downward.
Fund facilitating conditions as a launch requirement: migration, training, support channels, and hardware compatibility, with a named owner for each.
Segment your adoption plan by the 4 moderators. Older and less experienced users need more facilitating conditions; voluntary users need more demonstrated value.
Measure actual usage, not stated intention, and compare the two. A large gap means one of the 4 forces is failing in the field.
Demo only what the product reliably does, because expectation debt compounds and gets repaid in churn.
For consumer products, add the UTAUT2 factors: design for enjoyment, defensible price value, and habit formation through consistent triggers.
Adoption Must Be Earned 4 Times
UTAUT’s lesson is that adoption has no single cause, so it has no single fix. A product must be worth using, easy enough to use, socially endorsed, and practically supported, and weakness in any one force can sink the other three. Diagnose before you evangelize. The 23-year-old model keeps earning its keep for one reason: it converts the mystical question “why won’t they adopt it?” into 4 measurable ones.


Alice and Zimo diagnose a dying rollout with the 4 forces of the UTAUT model, in Seinen Realism style. (GPT Image 2)
Reducing AI Stigma: A 7-Step Action Plan for the AI Labs
AI stigma is UTAUT’s social influence force running in reverse: people fear that using AI marks them as lazy or as producers of slop. The AI labs can treat stigma as an adoption-engineering problem, attack it through all 4 forces, and measure their progress by how many users come out of hiding.
The preceding article framed adoption as 4 questions that every user silently asks. For AI, the third question, whether the people who matter approve, too often returns a “no.” As I documented in my article on AI stigma, identical work (same words, different byline) is rated as less reliable and less empathetic the moment it carries an AI label, and 52% of employees who already use AI are reluctant to admit using it for their most important tasks. Stigma is social influence with the sign flipped.
And one negative force jams the other three. Hidden use produces no vicarious proof of gains, so performance expectancy starves; hidden users swap no prompts and request no training, so effort expectancy stays inflated; and employers who never see the demand never fund the policies, tools, and support that count as facilitating conditions. The resulting equilibrium is closet adoption: everyone benefits privately, and nobody advocates publicly. The labs built the capability; the opprobrium is throttling the payoff.
7 Steps for the AI Labs
Stigma yields to the same 4 forces that drive adoption, if the labs work them deliberately:
Put admired practitioners on camera. Fund named, verifiable case studies in which respected domain experts walk through real AI-assisted work, with before-and-after numbers. One admired peer outweighs 10 lab press releases, and visible role models are the only known cure for a closet.
Commission independent blind evaluations, then publicize them. When judges don’t know the source, AI-assisted work often wins the comparison; restore the label and the ratings drop. Blind tests move the argument from prejudice to evidence.
Market the median. Every staged demo that outruns the shipping product creates expectation debt, and the resulting failures are generalized into “AI slop,” the reputational fuel of stigma. So publish typical performance and known failure modes. Honesty is cheaper than the debt.
Make quality the default. Ship templates, curated examples, and guardrails so that good output doesn’t require insider prompt expertise. A tool that rewards only wizards makes ordinary users look lazy or inept, and stigma feeds on both.
Ship policy kits with the product. Why should a frontier lab bother writing acceptable-use policies, disclosure templates, and training curricula for its customers? Because employees hide what their employer hasn’t blessed, and 80% of employees say that more training would make them more comfortable with AI. Facilitating conditions are the cheapest stigma lever inside organizations.
Reward disclosure across the ecosystem. Work with professional associations, journals, and schools on attribution norms that treat disclosed AI assistance as routine craft rather than confession. Nobody footnotes a spellchecker; AI assistance is headed for the same unremarkable status.
Track the disclosure gap. The preceding article warned that intention surveys overstate adoption; under stigma, usage surveys understate it. So instrument both telemetry and self-report, treat the distance between them as your stigma meter, and segment it by the 4 moderators, because stigma won’t press equally on every age, gender, and experience level.
AI Stigma Is an Adoption Bug
The labs have spent billions raising performance expectancy and lowering effort expectancy while treating the social half of UTAUT as somebody else’s department (public relations, presumably). That won’t do. Adoption must be earned 4 times, and with AI, one of the 4 forces is currently negative, which drags on the other three no matter how good the models get. Treat stigma as an engineering target with measurable components rather than a communications nuisance. Work the 7 steps, watch the disclosure gap shrink, and the closet will empty itself.


Alice and Zimo work on reducing AI stigma according to the UTAUT model, in Seinen Realism style. (GPT Image 2)
Too Many Barriers to Unlock Value

Turning the golden key once should be enough to let new users into your service: let them unlock value fast. (GPT Image 2)
Account creation. Permissions. A detour to the email app to confirm that the user’s email address is the user’s email address. Waiting for that verification link to arrive (anybody who doesn’t send confirmation emails within 1 second deserves a year roasting in the 3rd circle of Response Time Hell). Looking for the email in the spam folder. Tutorials, profile questions, integrations, the mandatory tour. Each key you require the user to turn felt small to the team that added it. Together, they form a portcullis: barrier bloat that stops the user before he or she sees any benefit.
The golden key is the shortest path to a meaningful result. Hand it over first. Ask only for what the task needs now, defer the rest via progressive profiling, and let users learn through real work, not homework.
My default threshold: first success within 5 minutes, and zero questions you can’t justify on the spot. Deliver a win in the first session; the paperwork can wait. But teams keep adding keys, one “quick requirement” at a time. Cut the keyring. Users came to open a door, not to carry hardware.
Sliders Are for “About This Much,” Never for Exact Numbers
A slider sets a value by dragging a thumb along a track. It shines when approximate values suffice and feedback is instant (volume, brightness, price ranges), and it torments users when precision matters. Show the current value at all times, and offer a text field whenever users know their number.

Direct manipulation at its purest: grab the value and drag it. A marble gallery flatters the slider; a 360-pixel phone screen doesn’t. (GPT Image 2)
Definition: A slider is a control consisting of a track that represents a range and a thumb that marks the current value; users change the value by dragging the thumb. Variants include the range slider (2 thumbs bounding an interval) and the stepped slider (detents at discrete values).
The lineage is proudly physical. William Oughtred’s slide rule (circa 1622) computed by sliding one scale along another, audio engineers have ridden linear faders on mixing consoles since the 1960s, and every dimmer switch is a slider that outputs lumens instead of numbers.
On screens, the scrollbar (Xerox PARC, 1970s) was the slider’s ancestor, and Ben Shneiderman named the underlying magic in 1983: direct manipulation, meaning continuous representation of the object, physical actions instead of typed syntax, and immediate visible results. The slider fits that definition to the letter. The landmark demonstration came in 1994, when Christopher Ahlberg and Shneiderman’s FilmFinder used range sliders as dynamic query filters: drag a thumb, and the result set updates live, no Submit button anywhere. Every price filter on every e-commerce site today is that paper’s grandchild.

Range sliders work when users are narrowing possibilities, not naming one sacred number. If the pile of fish updates as the slider moves, it’s easy to get the fish budget about right. (GPT Image 2)
Why Sliders Delight (When Used Right)
Instant cause and effect. Drag the brightness thumb and watch the screen respond; the feedback loop closes in milliseconds, which is exactly what direct manipulation promises.
The range comes free. A slider displays minimum, maximum, and the current position as a proportion of the whole. Users grasp “about 2/3 up” without doing arithmetic.
Perfect for satisficing. Most human adjustments mean “a bit more,” not “exactly 67.” Sliders make approximate intent cheap to express.
Range sliders tame big result sets. Two thumbs on a price track filter 3,000 hotels down to 40 while the user watches. Search becomes steering.
Invalid input is impossible. You can’t drag a thumb to “banana.”

Sliders shine brightest when users want to nudge a current state up or down slightly, without caring about the exact value. (GPT Image 2)
Where Sliders Torture Users
Why do designers keep misusing such a friendly control? Because the slider photographs well: it looks clean in a mockup, and mockups don’t have fingers.
The core failure is a precision mismatch: asking a coarse control for an exact number. Paul Fitts showed in 1954 that pointing time grows as targets shrink, and a slider covering the values 0–100 on a 300-pixel track allocates all of 3 pixels per value. On a phone, a fingertip blankets 30–40 values at once, so landing on exactly 37 becomes the drag-and-nudge dance: overshoot, correct, overshoot again, sigh. Booking sites that demand an exact budget via slider, and surveys that collect a respondent’s age this way, have chosen designer aesthetics over user arithmetic.

Sliders become instruments of torture when users must specify a precise value. (GPT Image 2)
4 more recurring sins:
No numeric readout. A naked thumb forces users to guess what they’ve set. Guessing is not input.

Show the value as the user slides, and update the readout in real time. (GPT Image 2)
Scroll hijacking on touch. A horizontal slider inside a vertically scrolling page intercepts scroll gestures, so users change a value when they meant to move the page.
Anchoring by default position. Park a survey thumb at 50, and you’ll harvest a suspicious bumper crop of 50s. A default is a suggestion, and suggestions bias answers; I’ve yet to meet a survey slider that didn’t editorialize.
Accessibility neglect. Users with hand tremor, plus everyone on a keyboard or screen reader, need arrow-key increments and announced values. Many sliders ship with neither.
Every one of these failures has a cheap fix, itemized below.
8 Design Guidelines for Sliders
Reserve sliders for approximate, feel-based values with immediate feedback: volume, brightness, playback position, filter ranges. If precision matters, the slider is the wrong tool.
Display the current value at all times, updating live during the drag. On touch, put it in a bubble above the thumb, because the physical finger hides the on-screen thumb.
Pair the slider with an editable number field whenever users may arrive knowing their exact figure, and keep the 2 controls synchronized.
Size the thumb at 1 × 1 cm or more (44 pt on iOS, 48 dp on Android), and extend the invisible hit area beyond the visible thumb.
Add detents at meaningful values (0, 50%, 100%, “recommended”) so common targets snap into place instead of requiring surgery.
Support the keyboard: arrow keys move 1 increment, Page Up/Down moves 10, Home/End jump to the extremes, and every change is announced to assistive technology.
On touch, leave generous dead space around horizontal sliders, or add − and + buttons, so page scrolling and value dragging stop fighting over the same gesture.
Label nonlinear scales explicitly. If the track is logarithmic, print intermediate values along it; an unlabeled log scale is a prank, not a control.
The slider is the analog knob of the GUI: wonderful for “warmer,” “louder,” and “cheaper-ish,” and it has earned 4 decades of service since direct manipulation got its name. But when the user knows the number, asking him or her to land a thumb on it converts data entry into carnival shuffleboard. Approximation is the slider’s home turf. Keep it there, show the value it’s producing, and hand precision work to the humble text field, which has never once overshot 37.
Testing Is Cheaper Than Failure
Aerospace engineers don’t debate whether a wing will hold. They blast it in a wind tunnel and watch. Do the same with design: expose the prototype to 5 real users and let the turbulence of confusion, delay, and error buffet it while cracks are still cheap to fix. Your team can’t feel this friction, because you ≠ user: you know where everything is and what every label means. Test participants don’t, and neither do your customers. A flaw found in the tunnel costs an afternoon. The same flaw found after launch costs an apology, a patch release, and a quarter’s worth of churn.

AI makes prototypes cheap. No excuses for skipping early user testing. (GPT Image 2)
A Final Thought


