
UX Roundup: Usability of AI “Skills” | UXR Job Listings | AI Comics Help Learning | Quick View | The AI Economy | Social Learning | Automated Ads

Summary: How AI “skills” are reused and other usability issues with skills | User research job listings for junior staff dry up, and senior staff need AI experience to be hired | Data comics generated with AI increase student learning | Quick view as a shortcut for seeing product info | The AI economy has $175 billion in revenue | AI use spreads from peers | Automatically creating advertisements based on a website

UX Roundup for July 17, 2026 (Meta Muse Image)
AI “Skills” Need Usability Engineering
“Skills,” the SKILL.md packages that extend AI agents with reusable expertise, have become a genuine unit of software reuse: the first large-scale study counted 41,662 of them in the wild. But adoption is copy-and-forget: 53% of reused skills never receive a single update, and the rules that govern how agents treat users go almost untouched. Skills are a new user-interface layer that deserves usability research, and I propose an agenda.

An AI “skill” is like a sourdough starter for the AI: it tells it how to get going. (GPT Image 2)
A skill is a sourdough starter for an AI agent: you copy it from somebody who baked before you, feed it your own project’s particulars, and keep it alive with regular care. New research shows that most people skip the care part. They grab the starter, shove it in the fridge, and keep baking with it as it dies. Bad bread follows.


My recurring narrator characters, Alice and Zimo, explain AI skills and the new study on their reuse. (GPT Image 2)
Skills matter because they industrialize reuse. One expert packages hard-won procedural knowledge (how to run a security review, build a slide deck, or write in a house style), and thousands of users inherit that competence without doing any prompt engineering. When I called AI the first new UI paradigm in 60 years, the shift was from commands to intent-based outcome specification. Skills are how good intent specifications get packaged, shared, and reused, and a well-tended skill library increasingly separates casual AI use from advanced AI use. The format was popularized by Anthropic’s Claude and now has an open specification, with registries such as skills.sh hosting tens of thousands.
So what happens to skills once they leave the registry? Haoyu Gao and 5 colleagues from the University of Melbourne, Singapore Management University, and Heidelberg University just published the first large-scale empirical study of skills as engineered artifacts rather than mere agent capabilities. They mined 41,662 skills: 18,463 from the skills.sh registry and 23,199 personal-use skills across 5,876 GitHub repositories, then recovered 3,709 registry-to-local reuse links, hand-coded the content of 180 skills, and classified 444 modification diffs. A serious dataset for an artifact type that barely existed a year ago.
Adoption = Copy Once, Sync Never
The reuse numbers are stark. A whopping 70.3% of linked skill pairs are near-verbatim clones of the registry original. After adoption, 53% of reused skills never receive a single update. And frozen doesn’t mean fine: 40.2% of those untouched copies missed fixes their upstream originals later shipped. Even when adopters do edit, 62.3% diverge from upstream rather than pulling in its changes.
Thus, the skill ecosystem behaves like a package ecosystem without a package manager: no version pins, no update notifications, no dependency audits.
The stakes exceed ordinary documentation, and the authors explain why: a human reading a stale README can spot the discrepancy and route around it, but an agent executes a stale SKILL.md with full confidence. Call it skill rot: guidance that quietly decays while the machine keeps acting on it. Nobody proofreads at runtime.
The Interaction Contract Nobody Renegotiates
The content findings are where UX professionals should lean in. Coding 180 skills, the researchers identified 6 recurring content themes, and one is pure interaction design: 63% of skills script how the agent deals with its human, for example by gating consequential actions, such as merging pull requests, behind explicit user consent.
Now cross-reference that with what adopters and maintainers edit:

Even though user interaction is one of the main elements of AI skills, it gets almost no updates from skill adopters. (GPT Image 2)
Translation: whoever authors the first version of a popular skill is doing interaction design for thousands of downstream deployments he or she will never see. The consent gates, the escalation rules, the recovery behavior: adopters inherit them verbatim and never look back. The researchers call this stable core the skill’s behavioral contract, and it travels untouched.
One more red flag: maintenance is additive. In locally evolved skills, additions outnumber removals by 6.1 to 1. Skills grow; they’re rarely pruned. (In checking one of my own skills, I found 18 internal contradictions that had accreted across versions. Pruning is work. Skipping it is worse.)
6 UX Takeaways
Design the interaction contract first. Consent gates, escalation rules, and failure messages are the least-edited content in the dataset, so whatever you write at creation is what every downstream user will live with. Spend your best thinking there.
Write the description as microcontent. The YAML description is the skill’s information scent: it alone determines whether the agent invokes the skill. Activation metadata is the single most-edited element, which tells me the defaults are failing. Enumerate concrete trigger scenarios and explicit out-of-scope cases.
Treat adopted skills as dependencies, not downloads. Record the upstream source and diff against it on a schedule, because 40% of frozen copies are already missing upstream fixes. A quarterly review beats silent rot.
Prune on purpose. With additions outrunning removals 6.1 to 1, your skill will bloat into self-contradiction unless you schedule deletion passes. Every stale line costs tokens and risks steering the agent wrong.
Customize the bindings and leave the philosophy alone. The legitimate local edits are file paths, tool substitutions, and environment setup. Keep the core procedure intact so future comparisons against upstream stay readable.
Declare the optional metadata. Fields such as license, compatibility, and allowed-tools appear in only 3–16% of skills. The allowed-tools field in particular is a trust affordance for the person deciding whether to let your skill loose on his or her codebase.
A Research Agenda for Skill Usability
Gao and colleagues mined artifacts, not people. But repository mining can’t tell us what users experience, and as far as I know, nobody has watched a real user author, adopt, debug, or maintain an AI skill. That’s a gobsmacking gap for a mechanism this central to AI productivity. My agenda:
Discovery and selection. With tens of thousands of skills on offer, how does a user pick one? Do install counts mislead the way download counts misled in app stores? (Social proof doesn’t prove quality, only popularity.) Registry search deserves classic information-foraging research.
Pre-adoption vetting. Security audits cited by Gao’s team have already found exploitable vulnerabilities and credential leakage in community-authored skills. Can a non-expert assess a skill before installing it? My best guess (a guess until somebody runs the study) is that most users install skills the way they accept license agreements: unread. Test preview formats that let a person vet a skill in under a minute.
Activation debugging. Skills fire implicitly, and the heavy churn in activation metadata suggests users tune triggers by trial and error. We need tracing UIs that show why a skill did or didn’t invoke, plus studies of how people calibrate.
Authoring usability. Run think-aloud studies of first-time skill authors. What do they get wrong? Do the prefilled templates the researchers propose help? And what’s the optimal length? Registry skills run a median of 1,678 tokens; whether longer bodies help or hurt agent compliance is an open empirical question.
The cost of skill rot. Field-measure how often stale skills cause agent failures, and whether users can even attribute the failure to the skill rather than to the model. Then design and test notifications that make upstream drift visible.
Prose vs. scripts. Skills mix natural-language instructions (flexible but nondeterministic) with bundled scripts (rigid but testable). When should each carry the load? A dissertation awaits the Ph.D. student who maps this tradeoff across task types.
Skills Are an AI User Interface
Skills are how AI expertise compounds: one person’s mastery, everybody’s productivity. That makes them a user interface twice over: an authoring interface where humans encode intent, and a behavioral layer that scripts how agents treat the people they serve. Both halves are currently designed on instinct and frozen at adoption.
So feed your starter. Diff your adopted skills against upstream, prune the accreted sludge, and rewrite that activation description until the agent triggers exactly when it should. And researchers: the artifact mining is done, thanks to Gao and colleagues. Now let’s watch some actual users.
Junior User Research Jobs Getting Scarce; AI Experience Pays a 15% Premium

In mid-2026, the median salary for user researchers with AI skills was 15% higher than for UXR staff without AI skills. But to a first approximation, these jobs are reserved for senior staff. The tasks that juniors used to do are now handled by AI at the cost of a few tokens. (Meta Muse Image)
The new 3 R’s of UXR: For a Raise, Research Robots. Brian Utesch, Ph.D. (Head of UX Research at Cisco IT and co-creator of the UMUX-LITE questionnaire) analyzed 1,593 job postings for UX researcher positions collected in June–July 2026. AI now appears in 35% of postings, up from 10% in 2024 and 16% in 2025 in comparable data from Drill Bit Labs. Among the 728 postings that disclose pay, jobs mentioning AI offer a median salary of $178k, against $155k for jobs that don’t: a 15% premium, worth about $23k per year.

The share of user research jobs requiring AI skills more than tripled in only 2 years. I can’t imagine it won’t reach 100% by 2028. (Meta Muse Image)
What does “AI” mean in these postings? Having the skills needed to build AI products was requested 81% more often than having the skills to use AI tools within the research workflow. (Honestly, knowing how to use AI to do your job better should be table stakes these days, so many hiring companies probably don’t bother listing this.) Thus, one project shaping an AI feature beats a stack of prompt-engineering certificates on your resume.

If you want a career in the future, your overwhelming priority is to ship a product that uses AI. Building beats anything in the new world where any specific skill can be learned quickly through AI tutoring, if the AI isn’t doing that work itself in the first place. (Meta Muse Image)
The second finding is the seniority squeeze: 2/3 of postings target senior levels or above, only 10% welcome early-career researchers, and internships account for a measly 5%, while the median posting demands 5 years of experience. Newcomers must enter sideways: contract gigs, internships, or adjacent analyst roles. The front door is nearly shut.
Two more findings deserve attention:
Degrees matter less than feared. 56% of job listings still require a degree, despite universities’ growing irrelevance to an agency-driven builder workplace. Even though companies sufficiently enlightened to hire for talent rather than credentials remain a (growing) minority at 44%, most of the degree requirements were simply for a bachelor’s. Only 14% ask for a Ph.D. Spend resume space on outcomes, not credentials. (Slightly deflating news for those of us who spent years getting a doctorate.)
The classics anchor the craft. Usability testing appears in 67% of postings, with interviews and surveys at 50% each. Fancy methods come and go; watching users pays the mortgage.
The usual caveats apply: job ads tell us what employers want, which can differ from whom they hire, posted ranges omit equity, and the 2024–2025 trend splices in a separate sample (Drill Bit Labs coded 2,983 postings). But every mid-2026 figure was counted from real postings instead of estimated, so the direction is solid. Lead your resume with AI product research, name your methods exactly as employers do, and apply for the most senior title you can get away with, because those are most of the remaining jobs.

Build the skills and proven ability to ship AI products that will get you a job. Don’t assume that a shiny new diploma will get you an entry-level job. (GPT Image 2)
AI-Made Data Comics More Than Double Students’ Understanding of Data
In a controlled experiment with 60 university students, data comics drawn with generative AI beat conventional charts on every question type: median accuracy hit 75% vs. 33%. Comics helped most on hard comprehension tasks, but they lifted weak and strong readers by the same amount, so they don’t replace visualization literacy.
A chart hands readers a map. A data comic walks them through the territory with a guide who points out the sights. New research finally puts numbers on the difference: Zirui Shan and colleagues at Monash University, RMIT, and Hong Kong Polytechnic University compared the two formats in a within-subjects experiment with 60 university students, published on arXiv.
The team took 4 conventional climate-and-energy visualizations (stacked area charts and pie sequences) and rebuilt each as a data comic conveying the same insights. Panels were generated with DALL-E 3, prompted through ChatGPT and assembled in Canva, following Benjamin Bach’s design patterns for data comics, the closest thing this young genre has to a rulebook. Each student saw half the materials as charts and half as comics, counterbalanced, and answered 4 multiple-choice questions per display: half information retrieval (read off a value), half comprehension (derive an insight or spot the false statement among 4 options). Scores were corrected for guessing, a precaution too many studies skip.
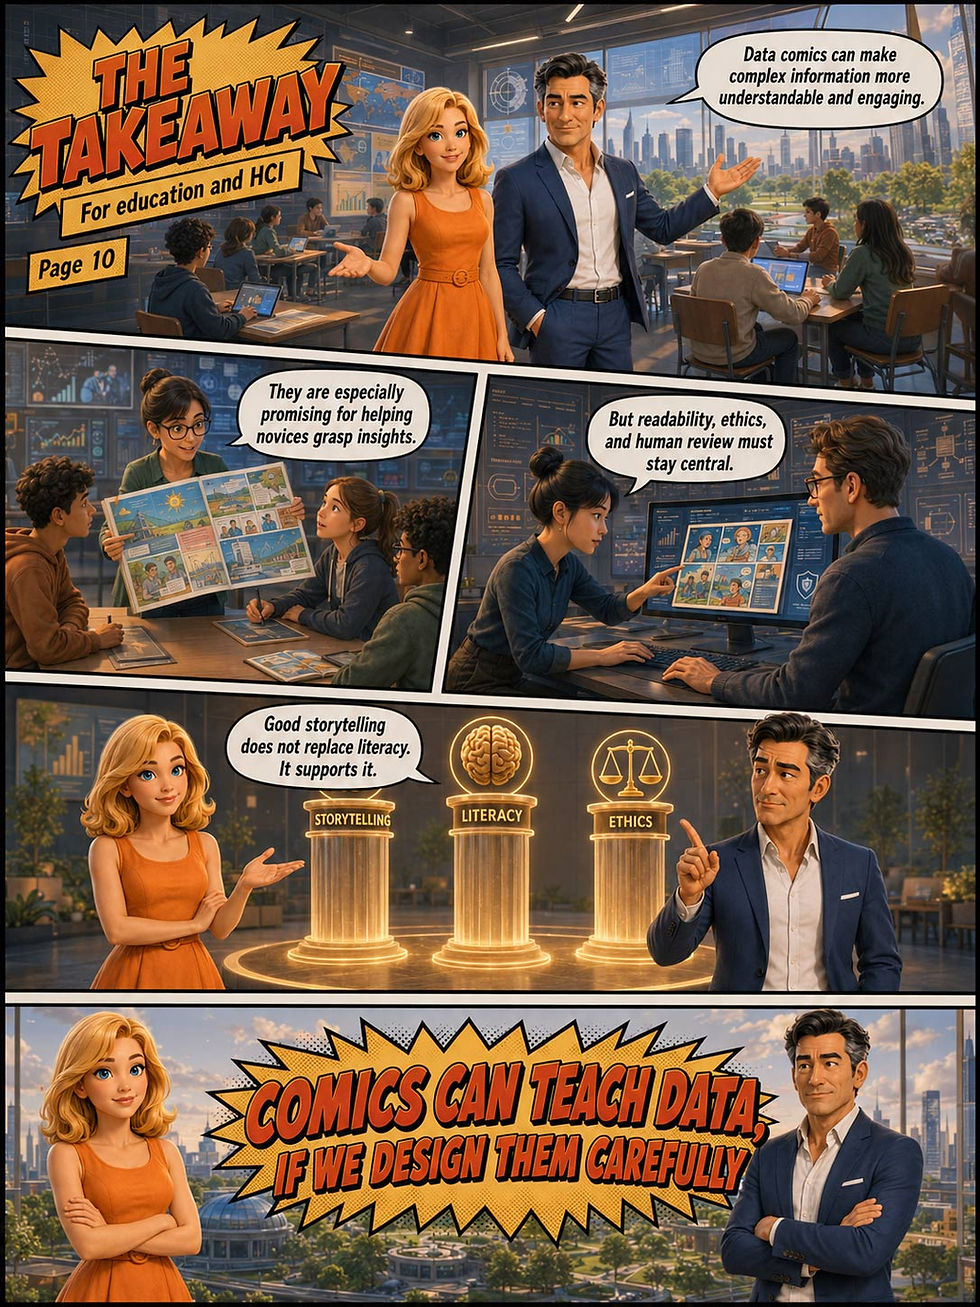
In the spirit of the study, I’ll use my own comic strip to explain it. I made this Alice and Zimo comic with GPT Image 2. This is a much better image model than the old DALL-E 3 used by the researchers, so I’d expect even better outcomes in future projects using GPT Image 2 or Meta’s new Muse Image, which is almost as good.


The Harder the Question, the Bigger the Comics Advantage
Comics won across the board. Median accuracy reached 75% with comics vs. 33% with conventional charts (p < 0.001, with a large effect size of r = 0.66). And the gap widened exactly where thinking gets expensive. Retrieval questions improved by 16 percentage points on average, a moderate effect. Comprehension questions improved by an eye-popping 42 points: the median student facing a conventional chart scored a corrected zero on them. Zero! Questions that required integrating multiple insights showed the starkest split, with a median score of 100% for comics vs. 33% for charts.
Call it the panel premium: the accuracy bonus readers collect when insights arrive pre-analyzed, one panel at a time, with trends annotated and comparisons spelled out in speech balloons. The comic’s author has already done the analytical heavy lifting, so the reader consumes conclusions instead of computing them.
That last sentence is also the fine print. Several comprehension answers were printed right in the comics (the near-doubling of wind power sits on an arrow in plain text), so part of the measured gain is reading, not reasoning. Hongbo Shao’s earlier experiment showed that annotated charts alone deliver much of this benefit, and Zezhong Wang found in 2019 that comics beat infographics on enjoyment and recall. Add that the new study used only 4 visualization pairs, all on climate topics, and a sample of 60 participants, including 22 doctoral students. Hardly a cross-section of humanity. But the within-subjects design, counterbalancing, and guessing correction are solid, and effects this large survive quibbles. As the first controlled test of GenAI-assisted data comics against conventional visualizations, the study clears the bar.
A Rising Tide That Doesn’t Close the Gap
Could comics be the great equalizer that lets chart-blind students catch up with their data-fluent classmates? No. Visualization literacy, measured with the 12-question Mini-VLAT instrument, strongly predicted accuracy in both conditions. Comics added roughly 28 percentage points for everybody, novice and expert alike; the interaction between literacy and format was nowhere near significance (p = 0.75).
Thus data comics raise the floor and the ceiling by the same amount. That finding deserves attention because it breaks a pattern: in my writing on AI and skill gaps, I’ve documented how AI tools compress the spread between weak and strong performers. Data comics don’t. They’re a ramp, not an elevator; everyone climbs, but nobody changes floors. So deploy comics for communication, and keep teaching people to read charts, because the literate reader extracts more from whatever format he or she is given, comics included.
Students Cheered the Comics, Then Booed the Robot
Perceptions matched performance. Fully 90% of participants (54 of 60) called comics more accessible and efficient than charts, and 44 praised their engagement value. (20 also claimed comics were easier to remember, but the study never tested memory, so file that under self-report.) Still, 60% flagged drawbacks: busy layouts that bury the key number, and, more astutely, the author-guided narrative. One participant objected that comics limit “the audience’s ability to make their own opinions or extract their own insights.” Exactly right. The pre-chewed insight is at once the format’s superpower and its bias risk, because whoever sequences the panels decides what you conclude.
The twist came at the end, when the researchers revealed that all the comics were AI-generated. Suddenly 75% expressed misinformation concerns, 2/3 worried about bias, and 37 of 60 fretted over copyright and ownership. Note the irony: these same students had just performed twice as well with the AI-made material. It’s sad that AI stigma remains in effect, even among university students who have just benefited from AI-assisted learning. Reducing AI stigma should be a top priority for AI labs to spend their billions on.
Conclusion: Let AI Draw, but Keep Humans Directing
Rodolphe Töpffer, a Geneva schoolmaster, published the first modern comic strips in 1833, partly to amuse his students. Two centuries later, the format is returning to the classroom with an AI inker, and the evidence says it works. My advice:
Use data comics for novice and mixed audiences. Student dashboards, executive summaries, and public reports are prime territory. Expert analysts still need raw charts for open-ended exploration, since comics show only what the author chose to show.
Split the labor the way the researchers did. Humans extract the insights and sequence the story, AI draws the pictures, and humans verify every number in every speech balloon before publication. One hallucinated digit torches your credibility.
Disclose the AI involvement, and expect skepticism. Readers penalize trust, not comprehension. Earn the trust back with visible human oversight.
Keep funding visualization literacy. Comics raise everyone equally, but they don’t rescue the bottom of the class.
I practice what I preach: my own articles are illustrated with AI-generated comics, because a guided tour beats a map for first-time visitors. Just make sure the guide isn’t inventing the sights.
Quick View: Handy for Triage, Hopeless as a Product Page Substitute
A “quick view” overlays an item’s essential details on top of a list so users can inspect without navigating away. It shines for visual triage and misfires when it impersonates the full detail page: in Baymard Institute’s testing, shoppers mistook the overlay for the real product page and never saw the information that page contained. Fix the list item first; add a quick view only for what remains.

Quick view, dramatized: the rest of the catalog stays under wraps while one candidate steps into the light. In production designs, the “View Details” link carries the load. (GPT Image 2)
Definition: A quick view is an overlay or panel, opened from an item in a list or grid, that presents a summary of that item’s details (a larger image, price, key attributes, and a primary action) without leaving the list for a new page.
The user’s investment stays tiny: peek, judge, dismiss, move on. The pattern lives or dies on that tininess. The moment a quick view demands the attention of a full page while delivering less than one, it has lost its reason to exist.
From the Mac’s Spacebar to Every Store’s Product Grid
Apple shipped the pattern’s most elegant incarnation in Mac OS X Leopard (2007): Quick Look, where pressing the spacebar instantly previews a file at full size, and pressing it again dismisses the preview. Zero commitment, zero mode. E-commerce sites adopted “Quick View” buttons on product cards in the years that followed, promising relief from the tedious bounce between the product list and the product pages. (Jared Spool named that bounce “pogo-sticking” long ago.) The name itself needs no etymology lecture: it’s a view, and it’s quick. Would that all pattern names were this honest.
Why Quick View Works: Inspection Without Losing Your Place
What does each trip to a full product page cost the user? three things: a page load, the cognitive reset of parsing a new layout, and the relocation work of finding his or her position in the list afterward. Multiply by 15 candidate products, and a browsing session becomes mostly overhead. A quick view eliminates all three costs for the products that only needed a glance.
The benefit concentrates in visually driven products: apparel, furniture, decor, art. Baymard’s testing found that for such goods, the enlarged image often settles the matter by itself; a user judging a dress mainly needs to see the dress bigger. Desktop file managers prove the same point daily: spacebar, glance, arrow, glance, and 30 files are triaged in a minute. Quick views also preserve the list’s sort order and scroll position, which users have often invested real effort in setting up.
How Quick View Fails: The Quick-View Cul-de-Sac
Baymard Institute has tested this pattern with real shoppers for over a decade, and the findings are unflattering. At the pattern’s 2015 peak, its benchmark found 48% of top US e-commerce sites offering quick views; the shine has since worn off, yet its current benchmark shows 21% of sites still shipping the feature for spec-driven catalogs, where it helps least. The signature observed failure: shoppers mistook the overlay for the actual product page. Ponder what that error costs. The shopper “reads the product page,” finds no size chart, no shipping terms, no reviews, concludes the site is hiding basics, and leaves. The real page had everything. He or she never saw it.
This design flaw is the quick-view cul-de-sac: an overlay that lacks the information needed to decide, while obscuring the road to the page that has it. Two further failure modes compound the damage. Hover-triggered overlays open by accident as the mouse crosses the grid, ambushing users en route to something else. And for spec-driven products (electronics, appliances, tools), Baymard concluded the pattern rarely helps at all: buyers need the full specification table anyway, so the institute’s advice is to skip the quick view and invest in a stronger product list. (Baymard sells research subscriptions, so season to taste, but the finding rests on moderated observation of real shoppers, and it matches what I’ve watched users do since the 1990s: treat whatever fills the screen as what the site has to offer.)
The cures are direct: make the link to the full page the most prominent element in the overlay, include the 3–5 attributes that genuinely decide purchases in your category, and open only on a deliberate click, never on a hover.
8 Design Guidelines for Quick View
Fix the product list first. If list items already show the deciding attributes, a quick view may be redundant; Baymard found that strong lists eliminate the need for most users.
Open on click or tap only. Hover-triggered overlays ambush users who were aiming at something else, and they don’t exist at all on touch screens.
Make the full-page link unmissable. A large “View Full Details” button within the quick-view card, not a text whisper, is the single best defense against the cul-de-sac.
Include the decisive attributes. Price, availability, ratings, and the 2–3 category-specific facts (fabric, dimensions, compatibility) users need for a keep-or-discard call.
Keep it visually distinct from the page. The dimmed list should remain visible behind the overlay, with a prominent close control, so nobody mistakes the peek for the page.
Return users to their exact spot. Closing the overlay must restore the scroll position and any selections; place-keeping is the entire point of the pattern.
Rethink it on mobile. A small screen makes the overlay nearly page-sized anyway, so most sites should link straight to the product page there.
Drive both views from one source. The quick view and the product page must never disagree on price or stock; a mismatch is a lawsuit-adjacent bug, and shoppers punish it with abandonment.
The AI Economy Is Real: $175 Billion in Revenue, Growing 3x Faster Than the Internet Did
Exponential View’s new State of the AI Economy report measures $110 billion in trailing 12-month GenAI revenue, now running at a $175 billion annualized pace and scaling 3x faster than any prior IT wave. The demand side of my AI analysis is confirmed, several of my 2026 predictions are ahead of schedule, and the industry’s remaining bottleneck is converting tokens into completed tasks.
Azeem Azhar and his Exponential View team have published The State of the AI Economy (June 25, 2026), the first credible attempt to measure AI demand rather than AI supply. Everybody can read Nvidia’s earnings; nobody could say what customers actually pay for machine cognition, because the biggest labs are private, and public companies bury AI revenue inside segment totals. That obscure demand underpins $22.7 trillion of market value. The team built a bottom-up model of 1,000+ firms, confidence-scored every source, and (crucially) deduplicated: $100 of app spend that passes $60 to a model provider, which spends $30 on hosting, counts as $100, not $190. My verdict: that discipline alone makes it the reference source on AI demand.
Demand Is Real: $1 Billion Every 2 Days
In 2023, the AI industry needed 180 days to add $1 billion in cumulative revenue. It now needs less than 2 days: a 90x acceleration in 3 years. Growth has held at 35% quarter-over-quarter (3.2x annually) across the two adoption phases the report labels the Chatbot Subscription Era and the Agentic Coding Era.
In How Big Is AI? Four Analogies, I argued the Internet is a useful starting analogy but a bad stopping point, and that AI’s impact will exceed 10x the Internet’s. The report supplies the velocity evidence: time-aligned to year zero and adjusted for inflation, GenAI revenue is scaling 3x faster than the Internet (1995), mobile apps (2007), or cloud (2010) ever did.
(A reconciliation note: Gartner’s $2.5 trillion figure for 2026 AI spending, which I cited, counts the shovels: data centers, chips, infrastructure. Exponential View’s $175 billion counts what customers pay for apps, models, and hosting, ex-China and deduplicated. Both are right; they measure different layers of the same machine.)
That machine is the one from my analogies article, where I called data centers cognitive power plants; the report likewise frames the stack as converting capital and energy into cognition. The plants are running hot: hyperscalers hold a $2.0 trillion contract backlog, and US electricity generation is growing again (+9 TWh/month per year) after 16 flat years.
Big Is Still Small: 0.42% of GDP
Now the part the boosters will skip. AI revenue equals 0.42% of US GDP, versus 9.4% for the IT sector, and corporate profits are 32x larger than all GenAI revenue combined. Even Uber, a top-10% AI spender per employee (capped at $1,500 per engineer per month), only spends roughly $90 million a year on AI: 0.2% of its revenue. A rounding error in the P&L.
And 7 in 10 corporate AI claims on earnings calls concern cost savings or efficiency, not revenue. Thus most companies are still sprinkling AI on industrial-era processes instead of redesigning workflows to be AI-first, exactly the trap I warned about. The prize for doing better shows up in the report’s Ramp data (n = 70,000 US businesses): the top quartile of AI spenders grew revenue 92 percentage points faster than firms with no AI spend since late 2022.
The report also quantifies what I could only assert: measured revenue understates AI’s value. Stanford Digital Economy Lab surveys peg US consumer welfare from AI at $14 billion per month against $11 billion of revenue, roughly a 30% consumer surplus on top of the bill. Electric lighting registered approximately $0 of direct GDP impact too, per Nordhaus’s 1996 analysis. History rhymes.
The $2 Trillion Buildout Meets Its Depreciation Bill
My Prediction 7 for 2026 was a persistent compute crisis; at my mid-year reality check, I scored it 88%, my highest mark. The report supplies receipts across my scorecard :

CapEx hits $2 trillion cumulative through 2026: $848 billion this year alone, $535 billion above the pre-AI trend. The sober math: the 2026 depreciation charge approaches $111 billion. Q4 2025 was the first quarter in which AI revenues exceeded quarterly CapEx depreciation, and headroom now sits at 19% for infrastructure players (32% across all GenAI revenue). In plain English: depreciation eats roughly 81 cents of every hyperscaler AI dollar before anybody pays for electricity, staff, or marketing. Coverage is real but thin. The report’s cheekiest finding: 8-year-old T4 GPUs still earn 42% gross rental yields, so betting on longer chip lives stretches headroom to 36%. The buildout is paying back, for now, and those last two words carry the whole investment case.
Tokens: Jevons Paradox, Finally Measured
In January, I invoked the Jevons Paradox: efficiency increases total consumption. The report measures it. Blended token prices collapsed from $17 to $2 per million (an 88% decline) while volumes grew 14x year-over-year to a staggering 30 quadrillion tokens per month. (Token counts include China, unlike the revenue figures. Noted.) Across providers, demand elasticity runs about 1.2–1.8: every 10% price cut yields 12–18% more tokens, so total spend still rises. The team flags that this is a time-series estimate that may overstate pure price elasticity. Methodological candor: rare and appreciated.

When something is cheaper, customers buy more. But how much more? That’s determined by price elasticity: if demand is highly elastic, it can skyrocket by much more than the price drop, meaning that seller revenues grow even though the seller gets less money for each unit sold. This is the case with AI. The world wants much more cheap cognition. (GPT Image 2)
Agents are the accelerant, as my Prediction 8 anticipated: an agentic coding task consumes 4.17 million tokens, roughly 1,200x a chat task. So what is a token actually worth? The report’s sharpest section admits nobody knows. Electricity found its unit of value in kilowatt-hours (Edison billed his first customers per lamp; metering came later), the web found clicks, and mobile found active users. AI bills in tokens, but a token measures cognition produced rather than problems solved. The report proposes quality-adjusted output tokens as the closest usable unit. I’ll push one step further, back to my January claim that the enterprise metric shifts from tokens generated to tasks completed: the true economic unit of AI is the completed task, and the token-to-task exchange rate is set by usability. Every confusing agent interface, unverifiable output, and forced re-prompt debases the currency.
No Moat, Confirmed: Intelligence Got Cheap, Access Got Expensive
The report exposes the commoditization mechanism behind my no-moat prediction: frontier labs earn a time-limited premium, and last year’s frontier diffuses into open weights within roughly a year. Among OpenRouter’s self-selecting model routers, Google, OpenAI, and Anthropic fell from 72% to 33% of token share in a year. And what are the labs doing about it? Exactly what my mid-year analysis said they would: converting temporary intelligence leads into durable access positions via vertical apps (legal AI from both OpenAI and Anthropic) and their own infrastructure (Stargate; Anthropic’s $50 billion data center program). Value is creeping up the stack: apps plus foundation models grew from 13% to 18% of deduplicated revenue in one year. Hosting still takes 82%, but UX lives where the other 18% is growing.
The report ends by asking whether falling prices can move enough token volume to repay the CapEx. My answer: only if the token-to-task exchange rate improves, and that rate is set by design. Here’s what to do about it.
To Plan Your Company’s AI Strategy:
Budget for elasticity, not a line item. Unit prices fell 88% while total spend rose. Manage tokens like cloud spend, with quotas, per-project attribution, and performance-per-dollar targets.
Copy the winners’ intensity. Uber’s top-10% spend is 0.2% of revenue: basically free. Against a 92-percentage-point growth gap between heavy adopters and abstainers, underspending is the expensive option. Aim past the 70% efficiency projects toward revenue-side workflow redesign.
Architect for model churn. Frontier premiums decay within a year as open weights catch up. Keep switching costs near zero and never sign long exclusives with today’s leader.
To Lead a UX Team:
Own the token-to-task exchange rate. Instrument task completion per inference dollar and report UX outcomes in the same units the CFO sees on the AI bill. UX = Profits, now with a meter attached.
Staff for verification, not generation. Agentic work burns 1,200x the tokens and produces output humans must check. Build capability in audit interfaces, risk-ranked review, and agent legibility before review fatigue caps adoption.
Treat compute as a design material. Rate limits, tiering, model routing, and honest disclosure of silent downgrades are core interaction design now, as unavoidable as screen size was in the mobile era.
To Plan Your Own UX Career:
Move to where the tokens flow. The Agentic Coding Era is the growth engine, and the app layer, where UX differentiates, is gaining share. Screen-polishing shrinks; agent and workflow design grows.
Learn to read this report. A designer who argues in margin per task, elasticity, and depreciation headroom gets invited to strategy meetings. One weekend of study buys years of credibility.
Pay for the frontier. The two-tier AI world rewards premium-tool mastery, and skills compound quarterly. Expense the subscription or buy it yourself, but don’t build your future on the free tier.
Edison’s customers paid per lamp because nobody had invented the meter. AI has a meter, and it’s spinning 30 quadrillion times a month. But customers don’t want electrons; they want light. Find a way to meter the AI light.
AI Use Spreads from Colleague to Colleague, Not from Promoting It

For as long as I’ve been in UX, one lesson has remained constant: users don’t read the manual. Social learning is by far the number one way of increasing users’ computer skills. (GPT Image 2)
Telemetry from Microsoft engineers shows that the strongest predictor of trying an AI coding agent is whether coworkers already use it: heavy peer exposure raised the odds of first use by 216%. We learned spreadsheets from the next desk over in 1986, and we’re learning AI agents the same way in 2026.
Emerson Murphy-Hill, Jenna Butler, and Alexandra Savelieva at Microsoft tracked tens of thousands of engineers through the company’s early-2026 rollout of two agentic command-line tools, Claude Code and GitHub Copilot CLI. They paired usage telemetry with HR records instead of relying on surveys, so we’re watching what engineers did, not what they say they did.
The adoption results form a clean hierarchy. When more than a quarter of an engineer’s skip-level peers (colleagues who report to the same manager’s manager) already used the tool, the odds of trying it were a whopping 216% higher than for an engineer with no exposed peers. A manager who used the tool raised the odds by 82%, and frequent code-review partners raised them by 54%. Meanwhile, tenure predicted nearly nothing, and career stage produced only a gentle gradient. What engineers do predicts adoption; who they are barely matters.

Observing colleagues achieve impressive results with AI motivates laggards to try it for themselves. (GPT Image 2)
And the spread is worth having: adopters merged 24% more pull requests, a lift that held across the full 4-month window and rose to +50% in weeks with 5+ days of tool use. (Two caveats the authors admit: the analysis can’t fully separate peer influence from homophily, since similar engineers cluster on similar teams, and Microsoft owns GitHub, maker of Copilot CLI. Still, the adoption pattern survived their sensitivity checks.)

The AI users completed 24% more tasks in this study. Note that this often doesn’t equate to creating 24% more value for the company, but the AI productivity lift does keep being confirmed. (GPT Image 2)
The Manual Nobody Read
Readers of a certain age will recall how they actually learned WordPerfect or Lotus 1-2-3. The 400-page manual stayed in the shrink wrap; the teacher was Carol, two desks over, who knew the keyboard shortcuts. RTFM (“read the fine manual,” in the polite expansion) was an insult precisely because nobody did. This was the cubicle curriculum: the informal syllabus taught desk to desk, absent from every training budget, yet the way computer skills have always spread.

Skills spread from desk to desk in the workplace. (GPT Image 2)
Murphy-Hill documented the mechanism a decade ago: peers are an effective way for software users to discover new tools, but such tool talk happens only once every few months. The bottleneck was frequency, not effectiveness. AI agents loosen that bottleneck because their output is conspicuous. A colleague who ships a gnarly refactoring in an afternoon gets asked how.
Make Use Visible
This study is behavioral confirmation of my playbook for building an AI-positive work culture, where National Bureau of Economic Research survey data showed 47% AI adoption when employers encouraged it versus 10% when they stayed silent. Now hard telemetry says the same: a visibly active manager nearly doubles the odds that a team member tries the tool. Culture beats curriculum, and the log files agree.

Culture beats curriculum, and AI rollouts are no exception. (GPT Image 2)
Make usage observable. Demos, shared prompts, and a standing 5-minute “what I tried” slot in team meetings. Skip-level exposure was the strongest signal, so broadcast wins beyond the immediate team.
Managers go first. Encouragement without visible personal use reads as performative; +82% is the payoff for practicing what you preach.
Buy tools and time, not curriculum. Formal training predicted nothing in the NBER data, while peer exposure predicted everything here.

Managers must explicitly endorse AI and showcase their own use to increase uptake. (GPT Image 2)

To encourage AI use, use it yourself, instead of sitting in the chair doing nothing. (GPT Image 2)
Conclusion: Rollouts Are Social Events
The manual didn’t teach the office of 1986, and the training deck won’t teach the office of 2026. New tools spread when people watch respected colleagues get real work done with them. Budget for visibility. The cubicle curriculum is already in session; your only decision is whether to give it a classroom.

To increase AI use, organize social learning events where colleagues show-and-tell how they use AI. (GPT Image 2)
Automatically Creating Advertisements with Gooseworks
A new AI service automatically creates social media promotions and advertisements, requiring almost no input other than your URL (from which it derives your brand proposition). You also pick your preferred styles from a set of existing ads that it will use as templates. The service is called Gooseworks Ads, and I have to compliment them on a memorable name.
Of course, I had to try this for UX Tigers, and here are some ads the Goose made for me in a few minutes of computer time and about a minute of my time:


(Gooseworks)
Pretty good promotions for UX Tigers. I can see small companies using this service and being happy with the results. Would Coca-Cola use them? No, these AI-generated ads aren’t up to the standards you get from paying millions of dollars to a high-end advertising agency. Yet. In two years, who knows.
Gooseworks didn’t get my logo quite right: that’s the downside of automatically downloading the low-resolution version from the upper right corner of my web pages instead of having access to higher-resolution assets. (There’s a feature to upload existing assets to a brand kit, but I wanted to see what I could get from pure AI.)
You get enough free credits to make about 10 ads, so go ahead and give this a try. You can change the aspect ratio to fit your needs. I just stuck with the default, since I don’t run any ads and thus won’t be using these creations beyond posting them here in the newsletter.

Gooseworks is currently mainly for smaller clients who can’t afford a high-end advertising agency. But I expect it to follow Clayton Christensen’s theory of disruptive innovation and gradually eat the markets of larger and larger ad agencies as it improves with more powerful AI language and image models over the next 2–3 years. (GPT Image 2)
Conclusion: Welcome to the Handoff Economy
In mid-2026, competence travels secondhand. A skill author scripts how agents will treat users he or she will never meet. A data comic pre-chews the analysis so students consume conclusions instead of computing them. Engineers adopt AI coding agents because a colleague two desks over shipped something impressive, not because anybody read the manual. Gooseworks turns a bare URL into finished advertisements. Even the humble quick view is a handoff: the shopper trusts an overlay to stand in for the full product page. Every item in this issue is about inheriting somebody else’s thinking, and every failure it reports (skill rot, the quick-view cul-de-sac, AI stigma) is a handoff that nobody verified.
The money says the arrangement works: GenAI revenue runs at a $175 billion annualized pace, scaling 3x faster than the Internet did, and user researchers who can build AI products collect a 15% salary premium. But the same numbers expose the constraint. Depreciation eats 81 cents of every hyperscaler AI dollar, the front door for junior researchers is nearly shut, and nobody has invented the meter that converts tokens into completed tasks. Call it the handoff economy: value is created upstream, consumed downstream, and lost in the middle whenever the interface fails.
That middle is UX territory. The state of affairs in one sentence: AI’s demand is proven, its supply is prodigious, and usability is the bottleneck that decides who profits. Intelligence got cheap. Verified handoffs didn’t. Closing that gap is the UX job of the decade, and unlike the junior listings, this one is wide open.

Handoffs require UX work to work well. (GPT Image 2)


