
UX Roundup: Practice Interviewing With AI | AI Answer Complexity | Date-Picking | NASA-TLX | Why vs. What | Activity Theory | Filtering | Commanding Heights

Summary: AI can’t simulate human research participants yet, but it can help interviewers practice before meeting real users | AI answers can drain users’ cognitive budgets through several kinds of complexity | Let users type distant dates | Simplifying the NASA-TLX instrument for measuring task load | The “why” is the true value of user research | Activity theory recommends designing for the whole job | Filter overload swamps users | Who will hold the “commanding heights” of the AI economy?

UX Roundup for November 2, 2026 (GPT Image 2.5)
Rehearse With Synthetic Users, Research With Real Ones
AI-simulated users are still too agreeable to serve as research evidence. But they make a superb flight simulator for interviewers. When 21 qualitative researchers rehearsed with AI participants, 17 revised their interview guides, often reconsidering whom to recruit.
In 1929, Edwin Link used bellows and other parts from his family’s organ business to build an early flight simulator, the Link Trainer. During World War II, more than 500,000 pilots learned instrument flying in Link Trainers. Nobody used the simulator to forecast the weather.

A simulator’s sky is always painted. Practice flying under it, but remember that real users fly in real weather. (GPT Image 2.5)
Synthetic users deserve the same treatment. As stand-ins for real customers, they still lack validity. In one benchmark, all 18 AI models came out nicer than real people. As rehearsal partners, they’re terrific. So treat AI personas as practicipants (practice participants), and collect your research data from flesh-and-blood participants.

Using synthetic users as research evidence is like forecasting from a flight simulator: the outlook is always sunny because AI personas are too nice to report a storm. (GPT Image 2.5)
Job Seekers and Language Learners Already Rehearse With AI
ADPList’s new AI interview coach lets job seekers in design, product, and UX research practice interviews out loud, with probing follow-ups and a scorecard. ADPList’s own fine print admits that practice scores don’t forecast who gets hired. Kudos for the honesty. The simulator trains the pilot, and the airline still decides who flies.

ADPList’s mock job interviews with AI let candidates practice until their nerves settle and their puffery deflates, well before the interview that counts. (GPT Image 2.5)
Language learners rehearse too. Stanford’s Danilo Symonette and co-authors had 40 learners of Japanese converse with AI characters in mixed reality. The learners recalled more vocabulary than they did after watching traditional language-practice videos. Their speaking showed no advantage, but one session is too short to judge lasting gains. Learners also felt more immersed, which bodes well for sustained practice.
Rehearsim, a new research system, brings the same idea to user research. AI plays the interviewee, and the researcher gets the practice.

Rehearsals with AI participants give you practice before the study. Even 40 simulated users equal 0 real ones. (GPT Image 2.5)
17 of 21 Researchers Revised Their Interview Guides
Hangyue Zhang and colleagues from the University of Illinois Urbana-Champaign built Rehearsim to generate simulated participants from published research on the target population. The system runs the interview guide with them, lets researchers add follow-up probes, and clusters answers into themes linked to source quotes. In the study, 21 qualitative researchers brought early-stage studies or fresh study ideas to sessions of up to 2 hours.
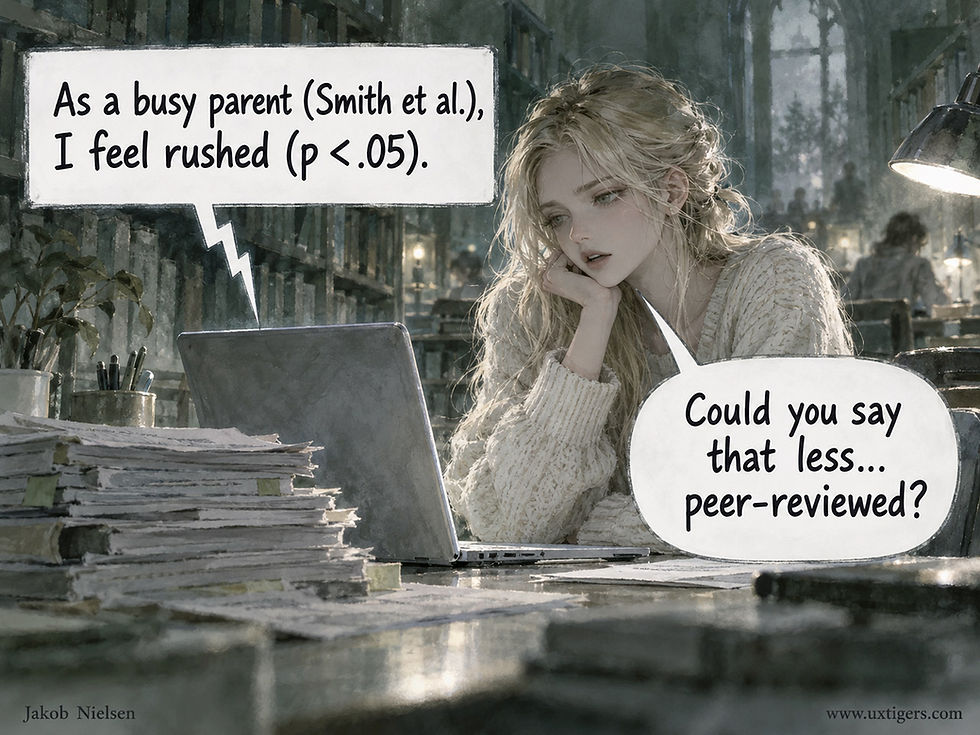
Rehearsim grounds its simulated participants in published research. The risk is a persona that sounds more like a literature review than a person. (GPT Image 2.5)
17 of the 21 researchers revised their protocols, and their changes went beyond wording.
In each of the three areas (research context, target population, and questions), 11 researchers made changes. They also added 12 new questions. A simulated subgroup of AI avoiders convinced one researcher studying selective AI use to recruit skeptics as well as fans. Another discovered that her food-delivery question assumed users know what they want to eat before opening the app.

Simulated subgroups reminded researchers to recruit people they had overlooked, such as AI avoiders. Finding those people with an AI recruiting bot is another matter. (GPT Image 2.5)

One simulated answer exposed a hidden assumption: that users know what they want before opening a food-delivery app. That holds only for koalas. (GPT Image 2.5)
AI Participants Are Too Easy to Interview
The AI participants were articulate and cooperative to a fault. Their answers often covered everything up front, leaving few openings to probe, and 9 of the 21 researchers felt the simulation made interviewing too easy.
A fluent respondent can also rescue a vague question by guessing what you meant, so the weak question survives into fieldwork, where real users will stumble over it. Even a persona told to be hesitant hesitated on schedule, starting every answer with “um.”

AI participants answer so completely that little is left to probe. Real people reveal themselves bit by bit, and probing is the skill you came to practice. (GPT Image 2.5)

After you rehearse with articulate AI participants, the first real participant can come as a shock. Order up a few terse simulated participants before you meet the real ones. I can’t tell you how many times I’ve been in the lab with a guy like this one. (GPT Image 2.5)
In August, I reported that an AI interviewer probed in only 4.9% of its turns. Now AI interviewees leave little to probe. AI is too polite in either chair.

When an AI interviewer that rarely probes meets AI participants that leave little to probe, the result is an endless loop of mutual flattery. (GPT Image 2.5)
Knowing that the material was synthetic also dulled curiosity. One researcher dismissed a surprising theme in three words: “Oh, it’s AI.” Others feared that generated themes would anchor their real fieldwork. Another researcher’s personas were far more international than any sample she could afford to recruit.

Knowing that the material is synthetic tempts researchers to dismiss surprises they would chase in a human interview. Sometimes that shadow overhead belongs to a real hawk. (GPT Image 2.5)

A simulated sample can span the globe for free, while real recruiting often ends at the nearest park bench. (GPT Image 2.5)
The study didn’t test whether rehearsed guides elicit better data from real people. It had no control group, and the quality gains were self-rated. Perceived improvements matched documented revisions only 52% of the time (Cohen’s κ = 0.14, barely above chance).
Still, a 2-hour rehearsal that exposes a missing participant group before you pay a cent for recruiting is cheap insurance.

One added comma, and the researcher rates the protocol’s rigor a perfect 7 out of 7. Self-ratings reveal confidence, whereas documented revisions reveal what changed. (GPT Image 2.5)
5 Rules for Rehearsing With Practicipants
Train novices with AI first, so they don’t burn through scarce recruits while learning to probe. A professor who normally role-plays participants in class could then spend more time coaching his or her students.

Novice interviewers have always practiced on someone polite. AI is as agreeable as Mom, but at least it’s available at 3 a.m. and never gets bored. (GPT Image 2.5)
Debug the interview guide against many subgroups to expose hidden assumptions and flush out people you may have overlooked.
Script difficult participants: make them terse, skeptical, or confused by your jargon. A flight simulator that offers only clear skies teaches nothing about storms.

Asked to be difficult, the AI participant agrees with delight, which defeats the exercise. Script the difficulty explicitly: terse answers, misread jargon, and open skepticism. (GPT Image 2.5)
Turn surprises into questions for the real interviews. Keep an open mind about what the simulated participants tell you until you’ve spoken to real people.
Quarantine the AI-generated themes so they don’t become hypotheses you set out to confirm during fieldwork.

Keep AI-generated themes in a sealed jar until fieldwork is done. Opened early, they turn into hypotheses that your interviews will dutifully confirm. (GPT Image 2.5)
My prediction: synthetic users will eventually graduate to evaluation research once benchmarks show that they match real behavior. That day hasn’t arrived. Until it does, collect your data from humans and practice with practicipants.

A perfect score against targets that never dodge proves little. Rehearse with AI, and then meet real users to find out whether your study works. (GPT Image 2.5)

After rehearsing your interview with AI, go talk to humans. (GPT Image 2.5)
AI Answers Have a Complexity Budget
There’s no single dial for making AI answers understandable. Length, readability score, vocabulary, and formatting each failed as a standalone rule in an analysis of more than 84,000 real ChatGPT and Gemini conversations about money and health. What mattered was the mix.

Headings make an answer easier to scan without making it any simpler to understand. (GPT Image 2.5)
Yingcan Carol Wang and colleagues from the London consultancy Stripe Partners (no relation to the payments company) mined chat histories shared by a paid, opt-in panel of 2,626 US users between July and October 2025. The researchers counted two repair behaviors: repeated or rephrased prompts, and complaints that users couldn’t follow the AI’s reply. Both are behavioral “huh?” signals.

Odin’s ravens, Huginn and Muninn, were mythology’s first field researchers, sent out every day to watch the world. Chat logs let us observe 84,000 conversations without interrupting anyone, putting number 8 on my list of top 10 UX slogans into practice: “Trust What Users Do, Not What They Say.” (GPT Image 2.5)
Rich Words Help Only Short Answers
Varied vocabulary was associated with less re-asking, but mainly in short responses. The advantage faded as answers grew longer in both finance and health (p < 0.001 for each). The authors propose a conversational complexity budget: what one property costs the user depends on what the others have already spent. I’ve made the same argument about cognitive load as a budget, so I’m delighted to see field data at this scale. Designers must manage the total answerload, meaning the combined mental cost of an answer’s length, vocabulary, density, and formatting.

Varied vocabulary can sharpen a short answer. In a long one, the advantage fades, and every new word for the same thing is one more puzzle for the reader. (GPT Image 2.5)

Answerload: length, rare words, bold, bullets, and headings all cross the same rickety bridge to the user’s understanding, and that bridge has a load limit. (GPT Image 2.5)
Two more findings will vex checklist lovers:

Each property can pass its own test while the mix still fails the user. (GPT Image 2.5)
Readability scores predicted little. The AI text’s Flesch score was unrelated to re-asking, and easier text came with slightly higher odds of confusion complaints. That’s no license to write like a tax attorney: Flesch counts syllables and sentence length, but it can’t tell whether an explanation of Roth conversion makes sense.
Markdown cut both ways. For every additional formatting element per 30 words, the odds of re-asking rose by 9–12%, though health chats also showed 22–24% lower odds of confusion complaints. My guess: each scrap of bullet confetti is clear on its own, yet the scraps can fail to cohere into an answer.
Learning Is the Hard Task
The user’s task mattered, too. Simple lookups had 15–39% lower odds of breakdown, whereas finance users trying to learn a topic had 2.6 times the odds of confusion complaints (1.3 times in health), even though learners delegated almost no judgment to the AI. Low delegation doesn’t mean low mental effort.

Finance users trying to learn had 2.6 times the odds of telling the AI that they didn’t understand its answer. Handing a beginner all 9 volumes at once is part of the problem. (GPT Image 2.5)

Learners delegate almost no judgment to the AI, yet they get confused more often. Teaching a subject can be harder than completing a task. (GPT Image 2.5)
The study has weaknesses. The data are observational, per-unit effects are small, the chats are a year old, and re-asking is a noisy proxy, since users also rephrase when an answer is plain wrong.
Gemini had about 4 times ChatGPT’s odds of re-asking. But it supplied only 3.5% of the conversations, and users weren’t randomly assigned, so don’t pick a vendor from that number.
Still, the findings suggest three practical steps.
Measure your repair rate. Repeated prompts and “I don’t get it” messages are free usability data hiding in your logs. The researchers flagged a repeat when a prompt’s similarity to an earlier one reached 0.72, so borrow that threshold for your own analysis.

A user who asks the same question 3 times is stuck. Count it as repair, whatever the engagement dashboard says. (GPT Image 2.5)
Set answerload by task. Give lookups short answers; give learners staged explanations, with a comprehension check before the AI piles on more material.
When an answer must be long, make everything else plain. Length has already spent much of the user’s complexity budget.

A long answer is a long hike from “Great question!” to “In conclusion.” Don’t make the trail steep as well. (GPT Image 2.5)
Simplicity is a budget, not a dial. Spend it where the user’s task needs it.

Length, vocabulary, density, and formatting all send their bills to the same purse. (GPT Image 2.5)
Let Users Type Dates They Already Know
Date entry covers two different tasks. Choosing a date (for a delivery next week) benefits from a calendar grid, because the user needs context: weekdays, availability, and how soon the delivery can arrive. Recalling a date (a birthday) needs no such context; the user has known it since childhood.
Yet forms give both tasks the same widget, with today as the default. Do the math for a customer born in April 1962 who faces a month-by-month picker in November 2026: 64 years times 12 months makes 768 taps backward, plus 7 more to walk from November back to April. That’s 775 taps, or nearly 13 minutes at a brisk tap per second, to enter a date the customer could type in 3 seconds.
Let users type known dates in a forgiving text field that accepts common formats, or at least offer year-first selection. Save the calendar grid for nearby dates, where seeing the week actually helps.

The birthday field asked a 3-second question and demanded a 13-minute answer. (GPT Image 2)
NASA-TLX: 3 Questions Do Most of the Work of 6
A meta-analysis of 683 tasks from CHI papers shows that 4 of the NASA-TLX’s 6 workload subscales largely overlap. A short version with Mental Demand, Physical Demand, and Performance should suffice for most studies. For software, I recommend swapping Physical Demand for Frustration. Keep the 0–100 scale, and warn participants that a high Performance score means failure.
The NASA Task Load Index was born in the cockpit. Sandra Hart and Lowell Staveland published it in 1988 to measure workload in aviation. Today, it rates a panoply of gadgets far from any runway, from VR headsets to AI chatbots. Within CHI, usage grew from 5 papers in 2006 to 99 in 2024, almost 10% of that year’s papers.
Definition: The NASA-TLX asks users to rate a task they just performed on 6 subscales (Mental Demand, Physical Demand, Temporal Demand, Performance, Effort, and Frustration), each from 0 to 100.

When ratings pile up, the questionnaire becomes the task. A shorter version lightens the load. (GPT Image 2.5)
Only 17 of 522 CHI papers used the original method’s 15 pairwise comparisons to weight the subscales. Most others simply averaged the ratings, a shortcut called Raw TLX.
4 Gauges Wired to the Same Sensor
Juyoung Lee and co-authors from KAIST, Georgia Tech, TU Clausthal, HU Berlin, and TU Munich reviewed those 522 CHI papers and analyzed subscale scores for 683 tasks in 185 papers. (When papers reported only charts, the team clicked on each bar and whisker to extract the numbers. That’s dedication.)
Mental Demand, Temporal Demand, Effort, and Frustration had pairwise correlations of .73–.86, stronger than in the original 1988 study. The authors group them as one cognitive-affective cluster.
Physical Demand anchored a second factor.
Performance was a loner: only 18% of its variance overlapped with the common factors, compared with half or more for every other subscale.
Picture a cockpit with 6 gauges, 4 of them wired to the same sensor. When one needle moves, the other three follow, so reading all 4 wastes respondent effort without adding much information. Physical Demand has its own sensor, and the Performance gauge is mounted upside down.

The NASA-TLX instrument panel: 4 of the 6 gauges read the same sensor, and the Performance dial runs backward, giving good performance a low score. (GPT Image 2.5)
The TLX still works. Pruning redundant subscales is easier than repairing a broken instrument.
Short TLX: 3 Questions for Most Studies
The authors’ Short TLX (STLX) keeps, in effect, one subscale per cluster: Mental Demand, Physical Demand, and Performance. They still prefer all 6 when the extra burden is acceptable. I’d use the full set only if workload is your main research question.

Half the questions, most of the information. For software studies, swap Physical Demand for Frustration. (GPT Image 2.5)
Use the STLX when ratings pile up. The typical CHI study compared 3–4 conditions, but some compared up to 36: 6 subscales × 36 conditions = a whopping 216 ratings per participant, or 108 with the STLX.
Bored participants answer on autopilot, producing data that reflect boredom more than workload. The STLX also suits repeated checkpoints during long sessions, such as an hour spent supervising an AI agent.

By condition 36, the participant’s beard has outgrown his patience. Don’t expect thoughtful ratings from here on. (GPT Image 2.5)
Software Users Don’t Lift: Swap Physical Demand for Frustration
Here, I go beyond the paper. Physical Demand asks, “How much physical activity was required (e.g., pushing, pulling, turning, controlling, activating, etc.)?” That’s the vocabulary of cockpit levers. Somebody filling out a web form or prompting a chatbot pushes nothing heavier than a mouse button. So ratings hug the floor in every condition, and a scale stuck at zero can’t tell designs apart. Researchers already sense this. The 3 CHI 2024 papers that dropped only Physical Demand studied an LLM prompt evaluator, a paper-alert tool, and a text-to-image tool. All 3 were pure software.

A famous old cartoon said, “All pumped from using the mouse,” but nobody needs a spotter to lift a mouse. Software users rarely face substantial physical demands, so most software studies can safely omit this scale. (GPT Image 2.5)

Don’t count Physical Demand out completely. In XR studies, the headset can strain the neck even when the task is easy on the mind. (GPT Image 2.5)
For software, I recommend Mental Demand, Frustration, and Performance. Effort had a .86 correlation with Mental Demand, so the two scales largely repeat each other.
Temporal Demand asks about “the rate or pace at which the tasks or task elements occurred,” which matters when you’re landing a plane but rarely applies when people use software at their own pace. Frustration overlaps less with Mental Demand (.77) and captures the emotional toll of usability problems: cryptic error messages, lost work, and dead ends. If your redesign works, Frustration should drop.
Much software use is discretionary, as are virtually all website visits. The original NASA crews, by contrast, used their systems as part of their jobs and couldn’t quit mid-flight.
Users can walk away, so their subjective satisfaction has direct business value. That makes Frustration worth measuring.
Keep Physical Demand for studies of headsets, gestures, wearables, and robots, as well as for Fitts’s Law pointing studies, where it outweighed every other subscale.

7 Guidelines for Any Version
Keep the original 21-point scale (0–100 in steps of 5). Coarse 5- and 7-point scales distorted the factor structure, pushing Frustration onto the physical factor.
Show the full question and its verbal anchors, not just the label. Participants who see only “Temporal Demand” must guess what the researchers mean.
Prevent flipformance. The Performance scale runs from Perfect (0) to Failure (100), so participants can easily flip it: 100 feels like an A+. Consider the damage. Suppose a participant breezes through an easy task, rates it 0 on the other 5 subscales, and proudly gives Performance a 100. The Raw TLX is 100/6 = 16.7, the same score as a harder task rated 20 on those 5 and 0 on Performance. Two very different experiences, one score. Spell out the direction, and if someone rates every demand low and Performance high, check for a flipped scale.

Everybody expects the trophy at the high end of a scale. On the NASA-TLX Performance scale, the high end reads Failure, so warn participants. (GPT Image 2.5)
Define the task concretely: “pointing and selecting the target as quickly as possible,” rather than “using the system.”
Compare conditions instead of interpreting absolute scores. The TLX has no HCI norms: a score of 60 has no inherent meaning, and 80 isn’t necessarily twice as demanding as 40.

TLX scores are hard to interpret in isolation, but useful when comparing two designs. Higher scores mean higher workload, so prefer the design with the lower score. (GPT Image 2.5)
Watch what users do, not only what they say. Pair the TLX with task time and success rates. Self-rated Performance can diverge from measured performance.
Document your cuts: state which subscales you dropped and why. Call the result “workload,” not “cognitive load”: the TLX covers more than the mind.
The authors’ free data-collection app defaults to the 21-point scale, highlights the Performance anchors, and lets you switch off subscales.
Caveat: Nobody Has Tested the Short Versions Head-to-Head
The analysis uses condition averages, which typically correlate more strongly than the individual ratings behind them. The paper also doesn’t validate the STLX against the full TLX, and nobody has tested my Frustration swap, which is hardly surprising, since I invented it today.
Here’s a thesis project for a motivated master’s student: rerun the raw data from 20 published studies and check whether the short versions reach the same conclusions. Meanwhile, 683 tasks offer a sturdier foundation than the hunches behind most subscale cuts in the literature.
In 1989, I introduced discount usability engineering: simplified methods that deliver most of the insight at a fraction of the cost. The STLX is discount workload measurement. Ask 3 questions: Mental Demand, Performance, and either Physical Demand (for bodies in motion) or Frustration (for software). Make sure participants know which end of the Performance gauge reads Failure.
One Why Is Worth a Hundred Whats
Surveys are octopus research: 8 arms, each clutching another clipboard full of whats. What percentage clicked? What score did users give? What option did they pick?
This inventory is useful, but it rarely tells you what to change. The whats describe behavior; the whys explain it.
One user thinking aloud while attempting a real task can reveal the why in minutes: the label that misled, the fear that stalled the purchase, or the workaround that made your feature unnecessary. Collect whats to size a problem and whys to solve it. When survey results puzzle you, go talk to somebody before you field another survey.

An armful of whats, and exactly one why. Guess which clipboard helps you improve the design. (GPT Image 1)
“Why > What” is number 6 on my list of top 10 UX slogans. Read the full list for the other 9.
Activity Theory: Design for the Whole Job
Activity theory says that a person’s use of a tool makes sense only within the whole activity: the motive behind it, the community involved, the rules in force, and the division of labor. Its 3-level hierarchy separates what users do from why they bother. The lesson for UX is blunt. Study the whole job around your product, or you’ll ship something that tests beautifully in the lab and flops in the workplace.
Most usability work zooms in tight: a user, a screen, a task, and a stopwatch. That focus has served us well, and I’ve spent much of my career defending it. A user who clicks the wrong button never gets to complete the activity.
Zoom in too far, and you miss the messy, social, rule-bound activity of which your interface is only one small part. Activity theory asks you to zoom back out.

The healthcare system’s goal is supposedly healthy patients. You might doubt it when you watch a physician pound on computer buttons, but those clicks are operations in service of the broader activity. (GPT Image 2)
The Unit of Analysis Is the Whole Activity
Definition: Activity theory holds that the proper unit of analysis for technology use is the whole tool-mediated, socially situated activity: a person pursuing a motive through tools, within a community, under rules, and within a division of labor. The user, task, and tool each form part of that activity.
People rarely act on the world barehanded. They act through tools, and the tools shape the action. A spreadsheet, for example, changes which calculations you even attempt. Change the tool, and you change the activity.

A new tool shapes which actions become possible, how labor is divided, which skills matter, and even what users understand the activity to be. So study both the workflow you intend to support and the new workflow your tool will create. (GPT Image 2)
The theory’s standard diagram, Engeström’s triangle, puts a social layer of community, rules, and division of labor at its base. For real products, that layer matters most.
A doctor entering a diagnosis into an electronic health record is a subject using a tool to reach an object (accurate patient care), inside a community (nurses, specialists, and the patient), constrained by rules (billing codes and privacy law), and working within a division of labor (who orders, who approves, and who bills). If you design the screen without seeing that web, you can “optimize” one node and break the whole system.

Engeström’s triangle as an art installation: the subject never touches the object directly. Tools, community, and rules carry every line of force; cut one string, and the whole activity changes shape. (GPT Image 2)
3 Levels Separate What Users Do From Why They Bother
For designers, the theory’s most useful idea is a 3-level hierarchy:

The payoff lies in the traffic between levels. With practice, conscious actions collapse into automatic operations: a novice thinks “now I click Send,” while an expert’s hands simply send.
Alexei Leontiev’s own example was shifting gears in a car with a manual transmission, which consumes a learner’s full attention and almost none of a veteran’s. (Automatic transmissions were out of reach for most Soviet drivers.) The process also runs in reverse. When a tool breaks or changes, operations become effortful actions again, and the user suddenly sees the interface instead of his or her work.
From Moscow to the Macintosh
Activity theory is Soviet psychology’s longest-lived export. Lev Vygotsky (1896–1934) laid the foundation in the 1920s–1930s with the idea of mediation, which holds that humans work through cultural tools, from hammers to alphabets. His student Leontiev (1903–1979) of Moscow State University built the formal theory and named it, taking activity (Russian deyatel’nost’) as the unit of analysis. His book Activity, Consciousness, and Personality (English edition, 1978) spelled out the motive–goal–condition hierarchy. Yrjö Engeström of the University of Helsinki widened the lens in Learning by Expanding (1987, PDF), adding community, rules, and division of labor to form the triangle.
HCI imported the framework in two waves. Susanne Bødker of Aarhus University analyzed interfaces as mediating artifacts in her 1987 dissertation, published as Through the Interface (1991). Then Bonnie Nardi’s 1996 anthology Context and Consciousness (MIT Press), with Kari Kuutti’s much-cited primer, argued that lab-bound task studies miss much of what makes a task worth doing. A usability lab can’t show you the manager who demands results in an hour.
Ask Why 3 Times Before You Design
The hierarchy earns its keep as a diagnostic. Feature requests arrive at the action level (“add a bulk-export button”), while value lives at the motive level (“I must prove compliance to an auditor”). So climb before you build: ask why 3 times to get from a requested action to the motive behind it. Toyota made the 5 whys famous for hunting down factory defects; in my experience, interface work usually reaches the motive by the third.

Ask why, why, why, and maybe even a few more whys. Don’t worry that you’ll sound like a 3-year-old. It works. (GPT Image 2)
The triangle supplies the questions the hierarchy leaves out. Who else is in the community? A design that ignores approvers, collaborators, and downstream recipients creates work at the seams.
What rules constrain the work? A tool that requires users to violate a binding rule is dead on arrival.
How is labor divided? With organizational software, the user, the community that judges the output, and the buyer who signs the check are three parties with three motives. Misalign them, and no amount of pixel polish will save the product.
The operation level pays off just as well. Stable placement and consistent shortcuts let muscle memory form. Every gratuitous redesign can turn users’ accumulated operations back into slow, conscious actions, which is why “we refreshed the UI” so reliably produces a spike in support tickets.
Breakdowns reveal the same process in reverse: when a user notices the tool, an operation has failed. Log those moments. They’re a free bug list.
Where the Theory Goes Wrong
The first failure mode is analysis paralysis dressed up as rigor: a quarter spent on triangle diagrams and glossaries of “mediating artifacts” while shipping nothing. I’ve read activity-theory analyses that ran for pages and never once said what to build.
The diagrams decorate the report while leaving the design team empty-handed. The second failure is treating the lens as a design method: activity theory will never tell you where the button goes.

Activity theory can easily become too much theory and too little design. Map the bakery if you must, but the cake won’t bake itself. (GPT Image 2)
The third and most damaging failure is motive myopia: polishing the visible action while staying blind to the motive above it. A time-tracking tool can make logging hours delightfully fast and still fail, because nobody’s motive is to log hours.
The motive is to get paid, to bill the client, or to be left alone by the finance department. Serve the motive, and users will tolerate the action; focus only on the action, and you’ve gilded a chore.
6 Design Guidelines for Applying Activity Theory
Ask why 3 times. Trace every feature request from action up to motive before writing requirements. Once named, the motive frequently suggests a smaller and better feature.
Map the triangle before you design the screen. Name the community, the rules, and the division of labor on a single page, then design the handoffs between roles. In my experience, the buyer–user conflicts this reveals predict adoption failure better than any lab score.
Protect operations. Keep placement, shortcuts, and defaults stable across releases. A redesign that relocates familiar controls taxes every expert to impress a few novices.
Treat breakdowns as data. Each moment a user consciously notices the interface marks a failed operation; harvest these moments from support tickets and session recordings.
Remember that the tool reshapes the activity. Your product will change the workflow it was meant to support, so anticipate the new activity your design creates as well as the old one it replaces.
Timebox the theory, then test at the bottom. A week of field study beats a quarter of diagramming. Motives help determine what to build. Usability testing with 5 users checks whether people can use the finished design and whether actions can become operations.
Conclusion: The Screen Is Part of a Larger Job
The person at your interface is a subject wielding a tool and pursuing a motive, embedded in a community, constrained by rules, and working within a division of labor.
The user may run operations that took months to learn. If you design as if the screen were the entire world, you’ll build something that wins in the lab and loses in the workplace.
So zoom out first, then zoom in for the usability details. Activity theory tells you where to look, and real users in their real context tell you what you’ll find there. The click still matters, but products live or die in the work around it.
Fewer Filters, Faster Choices
Filtering has one job: shrink a big list to a short one the user can compare. A swamp of controls reverses the work. Faced with two dozen facets, a raft of toggles, and a minimum-discount slider, users must solve a puzzle before they can choose. Clear all becomes the most-clicked button on the page. Baymard Institute’s 2015 usability tests of 50 top e-commerce sites found that mediocre product-list and filter designs lost 67–90% of users during product finding, compared with 17–33% for sites with a slightly better toolset.
Filtering is high-stakes plumbing.
Use analytics to identify the 5–7 filters users actually apply. Display those by default and fold the rest under More. Order filter values by frequency to put popular choices on top, and show result counts next to each value so nobody selects a dead end.
Never let a filter drain the list to zero without saying why. A filter that users must study is a feature they must escape.

Filtering was supposed to be the easy part. (GPT Image 2)
Commanding the Heights of Our AI Future
Last week, Silicon Valley was raving about a new analysis, “The Commanding Heights,” by Will Manidis and Joe Roberts. Manidis lives in New York and says that the essay took a year to write. He founded ScienceIO, a startup that built AI language models for healthcare, and was its CEO until the electronic health records company Veradigm bought it for $140 million in 2024. Since then, he has made early-stage investments in startups such as Chroma, Thatch, Silna, and Brain Co, and he writes essays in his newsletter, Minutes. Roberts has a particularly uninformative personal website that describes him as an American special-situations investor.
The essay asks where AI’s fortunes will settle and who is best positioned to collect them. The full essay runs 40,000 words, which is a lot, even for me. I routinely publish 6,000-word newsletters like the one you’re reading now.
To save you time and help you decide whether to read the full essay, I had Alice and Zimo explain the highlights in a 12-page comic strip, drawn with GPT Image 2.5 in Golden-Age Feature Cel Animation style.


I think the authors are too pessimistic about the future of jobs, because AI will create new work even as it speeds up the old. But many of the general observations in The Commanding Heights seem sound, even where I disagree with the specifics.
I’m sure AI labs will make good money, but they’ll probably end up like the railroads, which commanded only 7% of the value they created. Most of AI’s value will become consumer surplus, spread broadly across the world’s population.
Value arises where AI meets people. UX staff can create much of that value at this intersection and earn some of it. (Consumers will pocket most of it, but a few percent of trillions of dollars is still real money.)
To capture this opportunity, UXers must move beyond old-school screen design and use service design to invent AI-empowered workflows.
Final Thought of the Day


